StereonetStudio
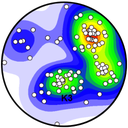
Professional stereographic projection (stereonet): polar/equatorial grid, poles, density contours, rose diagram, kinematic analysis (planar slide, wedge slide, flexural and direct toppling), with import from CSV/TXT files or project vector layers, plus local structural/topographic orientation acquisition from DTM rasters by mouse click. User interface fully translated (Italian/English).
StereonetStudio draws a stereographic projection (equal-angle / equal-area, lower/upper hemisphere, polar or equatorial grid) starting from structural data (dip/dip direction, strike/dip, trend/plunge), imported from CSV/TXT files or directly from vector layers loaded into the project (with automatic field selection in the menus). Modern tabbed interface (Stereonet, Data, Kinematic Analysis, Rosette), fully translated into Italian and English, with comprehensive options for labels, line weights, colors, poles, density contours (poles, intersections, data column; solid or line style, with fill extending to the great circle boundary), rose diagram of directions, and a complete kinematic analysis module (planar slide, wedge slide, flexural toppling, direct toppling) with envelopes, friction cones, lateral limits, and highlighted zones. The legend and density scale (both in bold, with configurable text size for title/legend/items) are positioned in the top left corner, right below the title which is always fully visible. The panel opens as a pre-resized window and stays on top until closed. Includes a dedicated DTM acquisition module with automatic selection of project DTM rasters, local-plane least-squares fitting, configurable sampling radius (1–15 cells), direct map-click acquisition, automatic calculation of Dip, Dip Direction, Strike, Pole Trend/Plunge, and X/Y/Z coordinates. Quality control includes cell count, RMSE, maximum residual, configurable RMSE threshold, optional rejection of measurements exceeding the threshold, and map highlighting of the fitting window. Multiple measurements can be acquired continuously, with a complete structural/topographic table, progressive IDs, Set/Group fields, and export file CSV, Geopakage and Shapefile. Valid measurements are automatically transferred to the Data tab, while preserving its existing format logic. DTM acquisition and UI logic are kept modular in separate components.