Before the advent of shipborne satellite navigation systems, navigation at sea required three precise measurements – Solar or Stellar Declination for Latitude, Time at Greenwich for Longitude and True North that determined the ship’s heading. True North was obtained from the ship’s Magnetic Compass, an instrument who’s name indicates at an additional complication.
A magnetic compass does not point towards True North. Magnetic North is 100s km from the Geographic North Pole and the Earth’s magnetic field is uneven, it is distorted by magnetic irregularities within the Outer Core and intrinsically magnetic Mantle and Crustal rock. Additionally, the position of Magnetic North is not fixed, it is presently drifting from Arctic Canada towards Russia at 15 km per year. Therefore True North has to be derived from Magnetic North using a correction called Magnetic Declination (or Magnetic Variation), the angular difference between Magnetic North and True North. Magnetic Declination varies from location to location and over time.
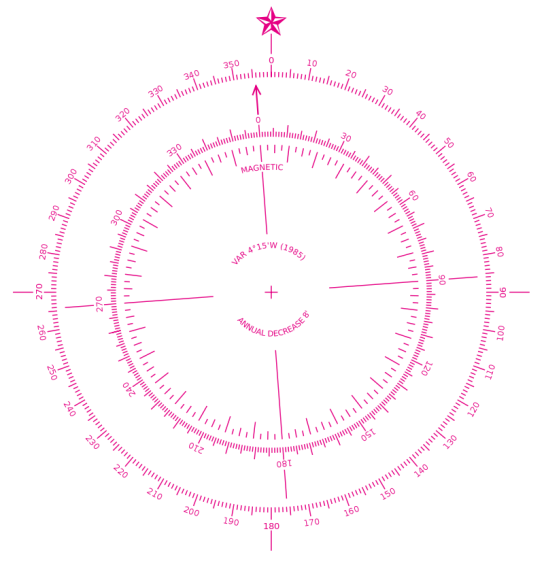
Nautical navigation charts typically contain one or more Compass Roses, also called a Windrose, these consist of two circles – an outer circle that displays the cardinal directions of North, East, South and West and a inner circle that displays the direction of Magnetic North. The Magnetic Declination and its annual rate of change is typically printed within the Compass Rose, it is therefore possible to calculate the Magnetic Declination several years after a map is printed.
In this tutorial I will show you a process that to create a Compass Rose with the correct Magnetic Declination and Annual Rate of Change for any terrestrial location for use in QGIS. First we need to obtain a suitable Compass Rose graphic. Conveniently the United States National Oceanic and Atmospheric Administration (NOAA) published a Compass Rose in the Public Domain i.e. it is free to use without limitation. I downloaded a version of the NOAA Compass Rose from Wikimedia (or you can right click and save the Compass Rose below). Additionally, the background of this Compass Rose is transparent, this allows a map (or indeed a web page) to show though (note the Magnetic Declination in 1985 was 4 degrees 15 minutes west of True North and it had an annual decrease of 8 minutes of a degree per year).
There are several handy on-line utilities that can calculate Magnetic Declination and the Annual Rate of Change but we shall use Charles F. F. Karney’s excellent cross-platform GeographicLib in this case. GeographicLib is a suite of command line utilities for solving solving various geodesic problems such as conversions between geographic, UTM, UPS, MGRS, geocentric and local cartesian coordinates, gravity calculations, determining geoid height, and magnetic field calculations. The latest version can be obtained as a pre-compiled binary from Sourceforge or as source code.
The other essential step is to measure the precise map location in WGS84 coordinates. This can be done using the Coordinated Capture plug-in provided as standard with QGIS. To select the WGS84 coordinate reference system (CRS) click the sphere symbol in Coordinated Capture panel to open the Coordinate Reference System Selector. After setting the CRS to WGS84 (EPSG: 4326), click the icon left of the “Copy to Clipboard” button (this toggles real time display of captured coordinates) and then click “Start Capture”. The position in Decimal Degrees will be updated in the upper window as you move the cursor across the map, the lower window will display projected coordinates (in my case Pseudo Mercator EPSG: 3857). Clicking the map will select a coordinate point and the real time display will cease updating.

The MagneticField utility of GeographicLib is then used to calculate the Magnetic Declination and Annual Rate of Change for the captured coordinate, in this case a location east of Howth, Ireland.
$ MagneticField -r -t 2014-08-04 --input-string "53.37772 6.00935"
-3.57 67.81 18572.9 18536.9 -1152.2 45528.7 49171.3
0.17 -0.01 17.9 21.2 52.4 19.6 24.9
The results are: Magnetic Declination in degrees (-3.57); the inclination of the Magnetic Field in degrees (67.81); the horizontal strength of the magnetic field in nanotesla (18572.9 nT); the north component of the field (18536.9 nT); the east component of the field in (-1152.2 nT); the vertical component of the field in nT (45528.7 nT) and the total field (49171.3 nT). The numbers on the second line are the annual rate of change of these values, the first number is. We only need the first numbers on each line; the Magnetic Declination (-3.57) and Annual Rate of Change of Magnetic Declination (0.17). We can convert these to Degrees Minutes Seconds if required.
After calculating the Magnetic Declination and Annual Rate of Change, edit the NOAA Compass Rose in a graphics program such as GIMP or Photoshop. In my case I copied the inner circle to a separate layer and I rotated it 3.57 degrees anticlockwise. I then added text to the Compass Rose stating the Magnetic Declination (Var.) and the Annual Rate of Change (Annual Decrease). After editing the Compass Rose graphic I finally added it to my Nautical Chart as a Image in Map Composer of QGIS.
Further Reading:
Bowditch, N. & National Imagery and Mapping Agency, 2002. CHAPTER 3. NAUTICAL CHARTS. In: The American Practical Navigator: An Epitome of Navigation. Bethesda, MD : Washington, DC, Paradise Cay Publications, 9, 23–50. ISBN: 978-0939837540 http://msi.nga.mil/MSISiteContent/StaticFiles/NAV_PUBS/APN/Chapt-03.pdf


