In this post, we will walk you through basic steps to set up a survey project in QGIS desktop and using it in Input app to collect data in field using your Android or iPhone/iPad device.
Software needed
To start with, you will need to install the following software applications:
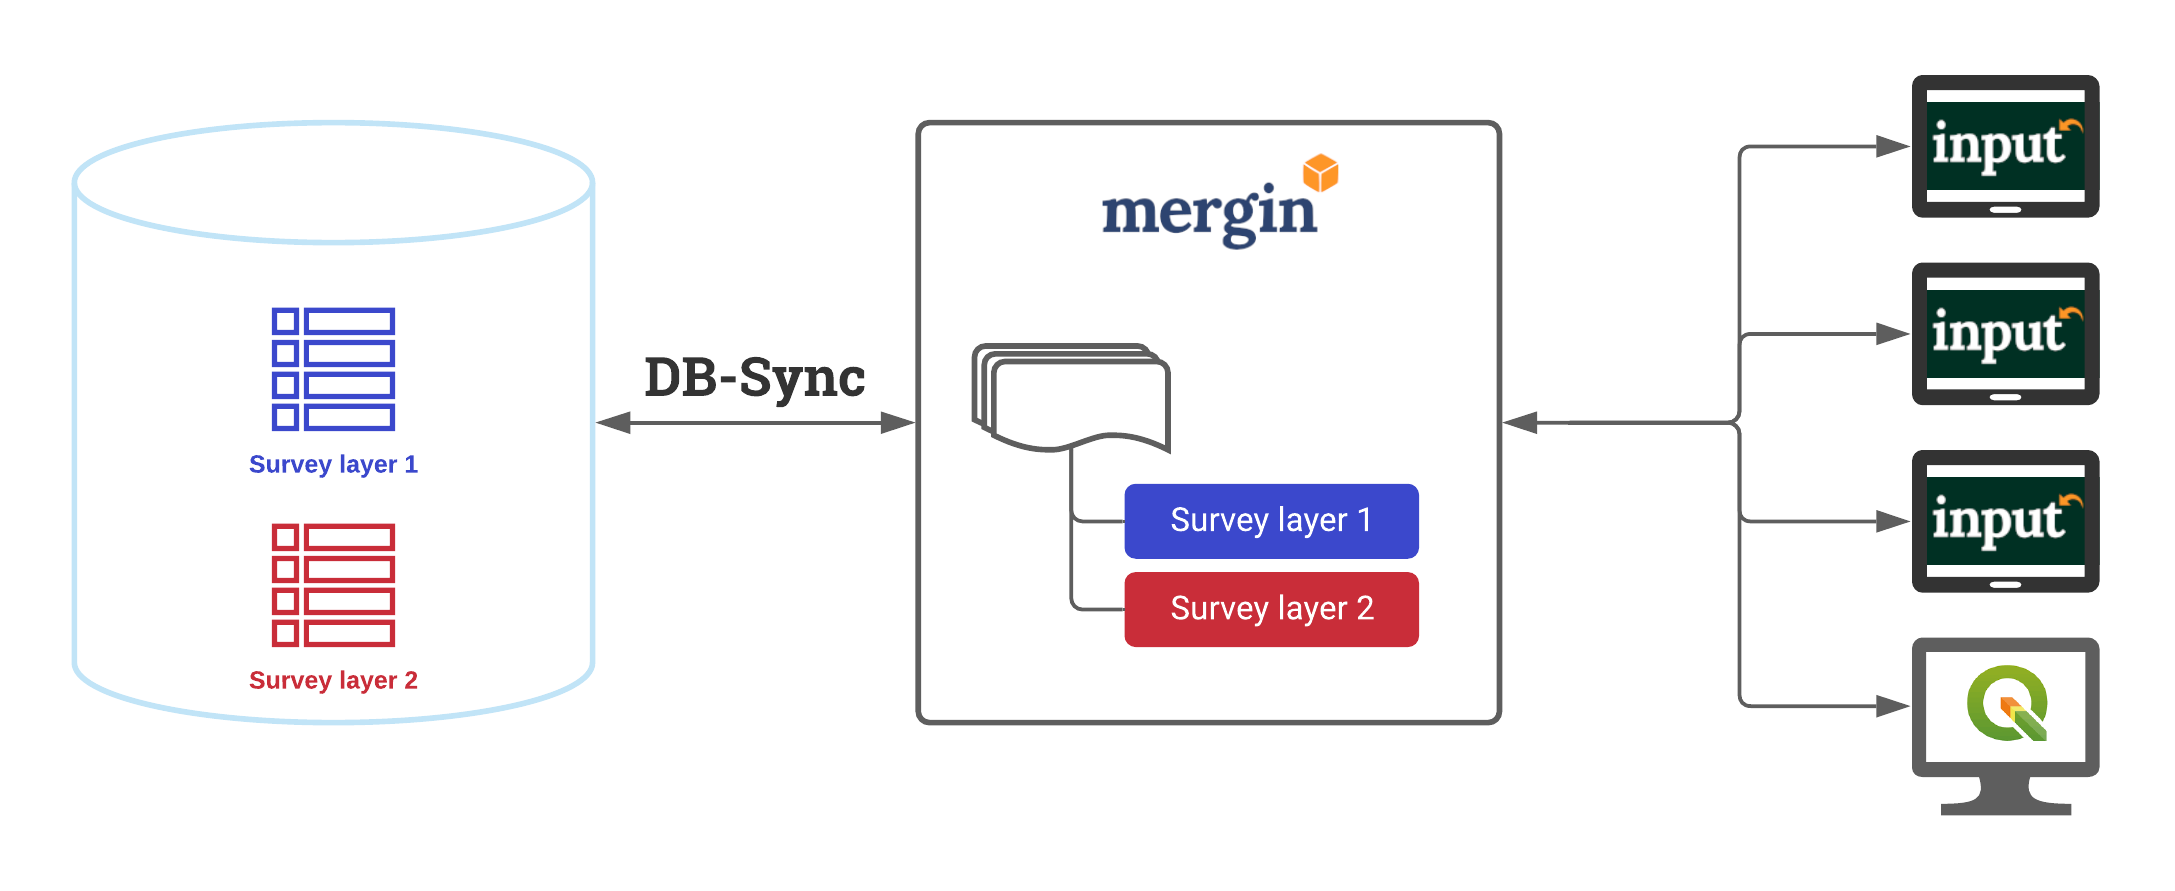
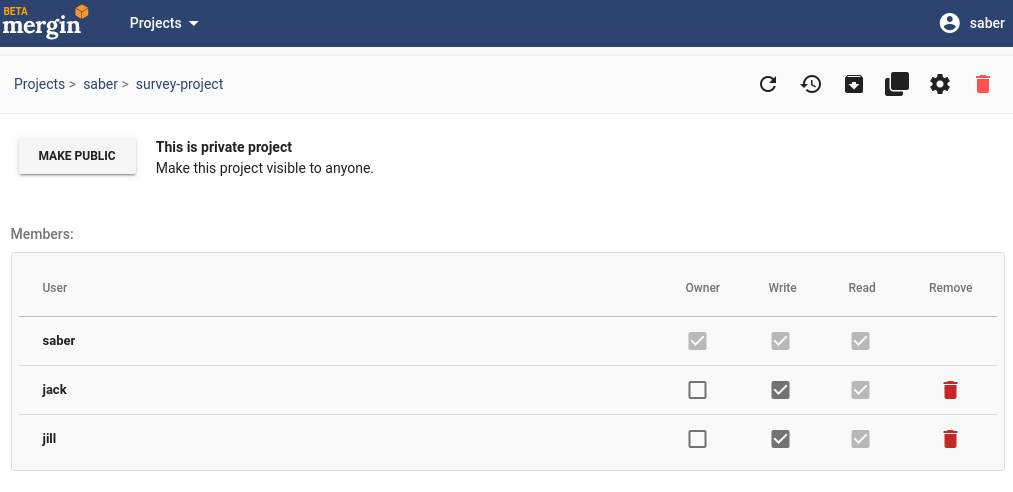
In addition, you will need to register with the Mergin service. The Mergin service allows you to transfer data between your PC/laptop and mobile/table via the cloud. Note that after signing up to the Mergin service, you have to activate the account by clicking on the link sent to your email.
Configuring QGIS project
To be able to survey data, we need to set up a project in QGIS. Usually, you will need some data for your background layer (so that you can locate yourself!). In addition, you need to set up a table (or layer), to store your survey information.
For background data, we are going to use Open Street Map. For survey table, we need to decide on a form structure and the type of feature you want to survey (e.g. point of interest, tracks or parcel of land). In this case, we want to survey potholes. Also, it would be good to attach some notes for each pothole, take a photo of it and add a date for survey. The GIS format best suited to store spatial information, is Geopackage.
Let’s start by opening QGIS and add the above layers to our project. To simplify things, we can create a folder on Desktop (referred to in this tutorial as data collection folder) and store everything there.
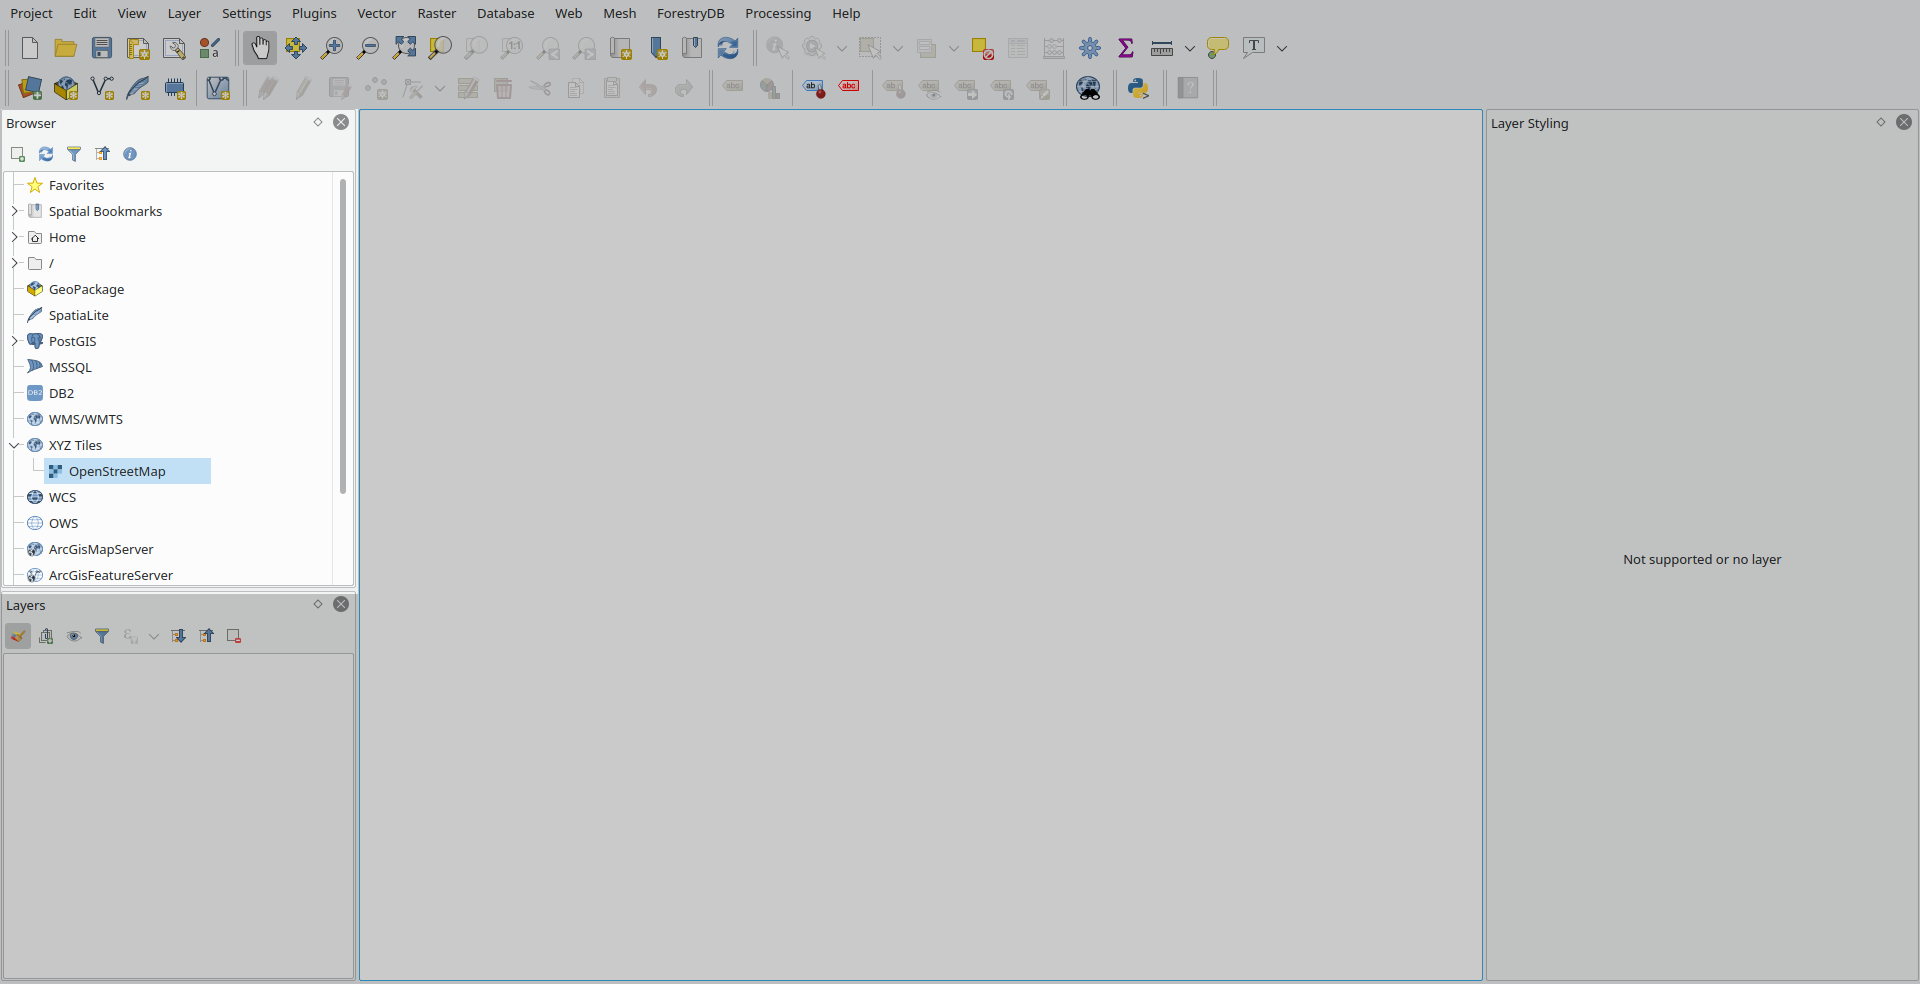
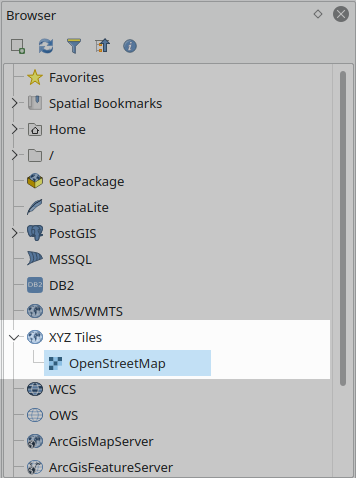
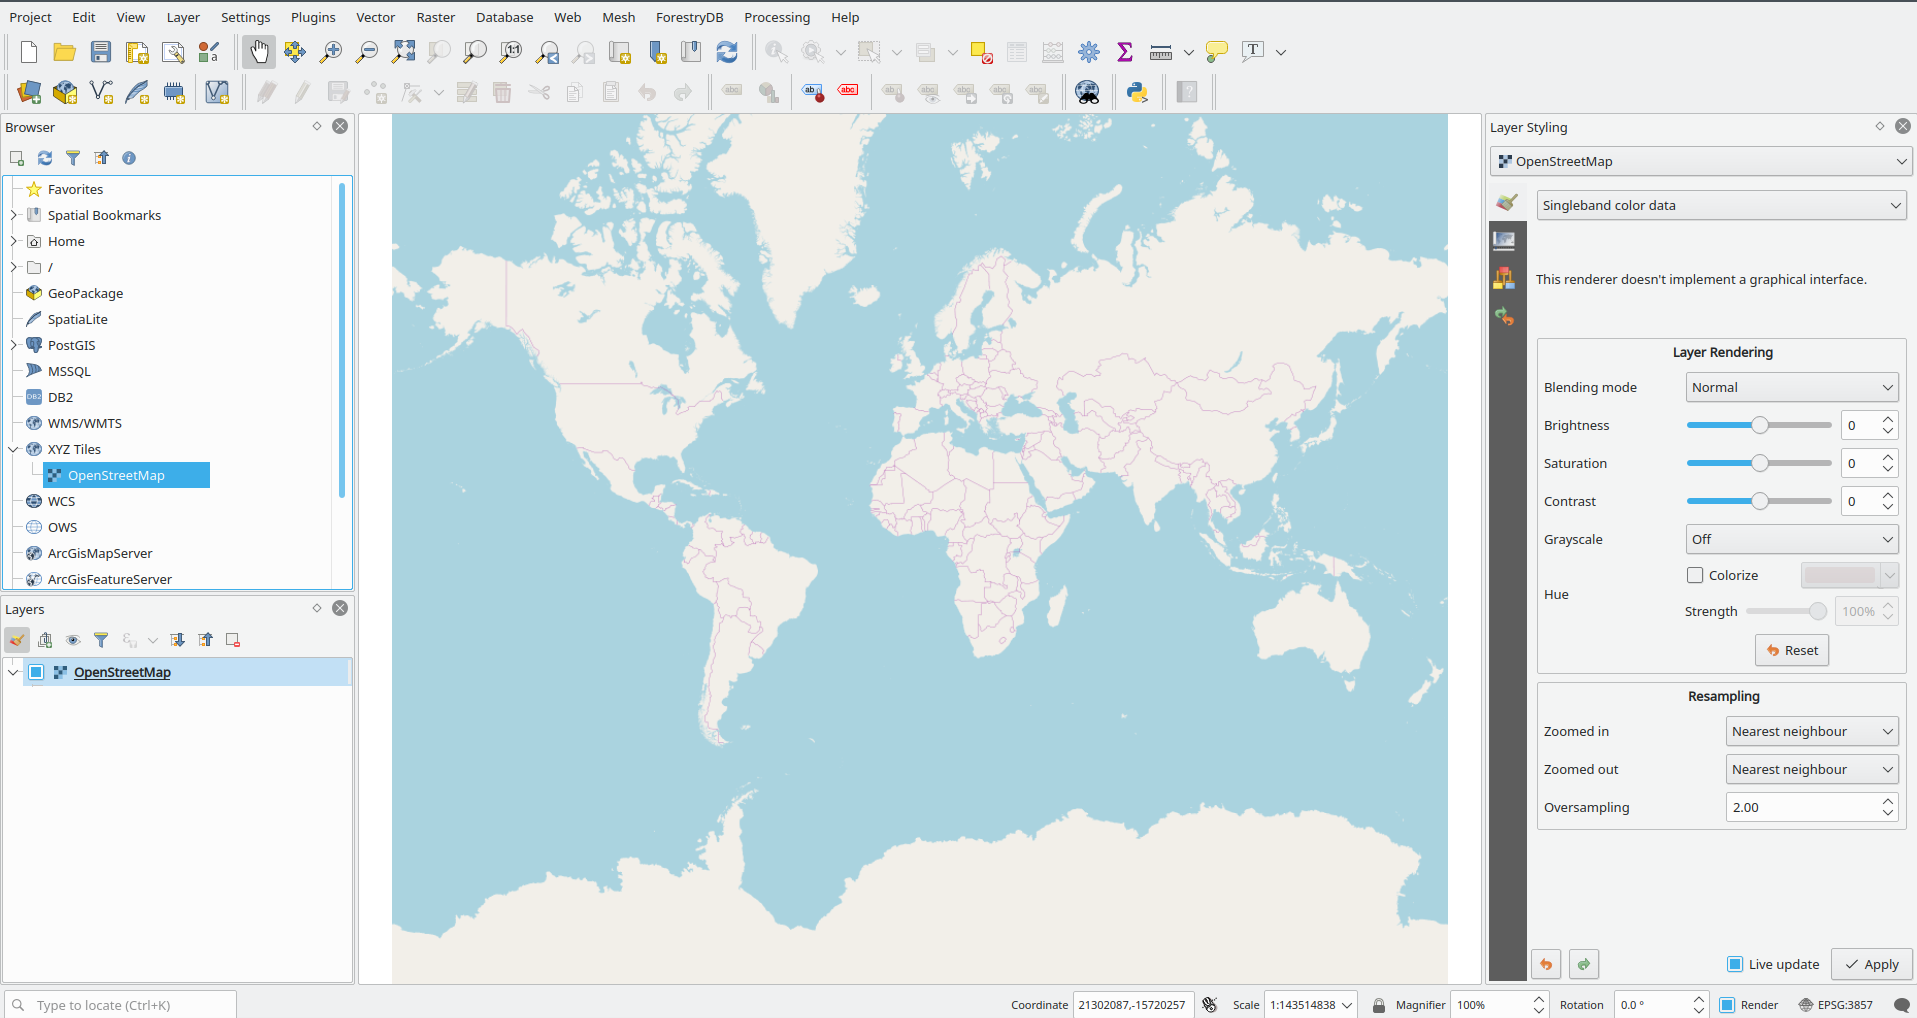
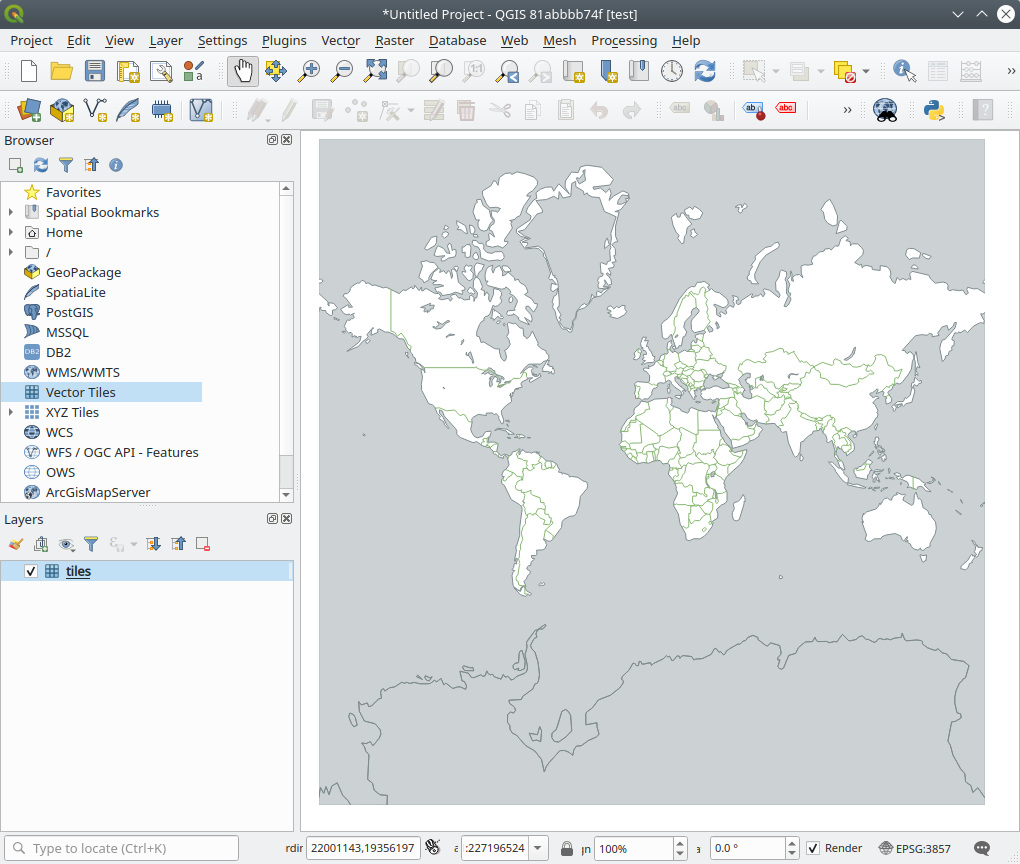
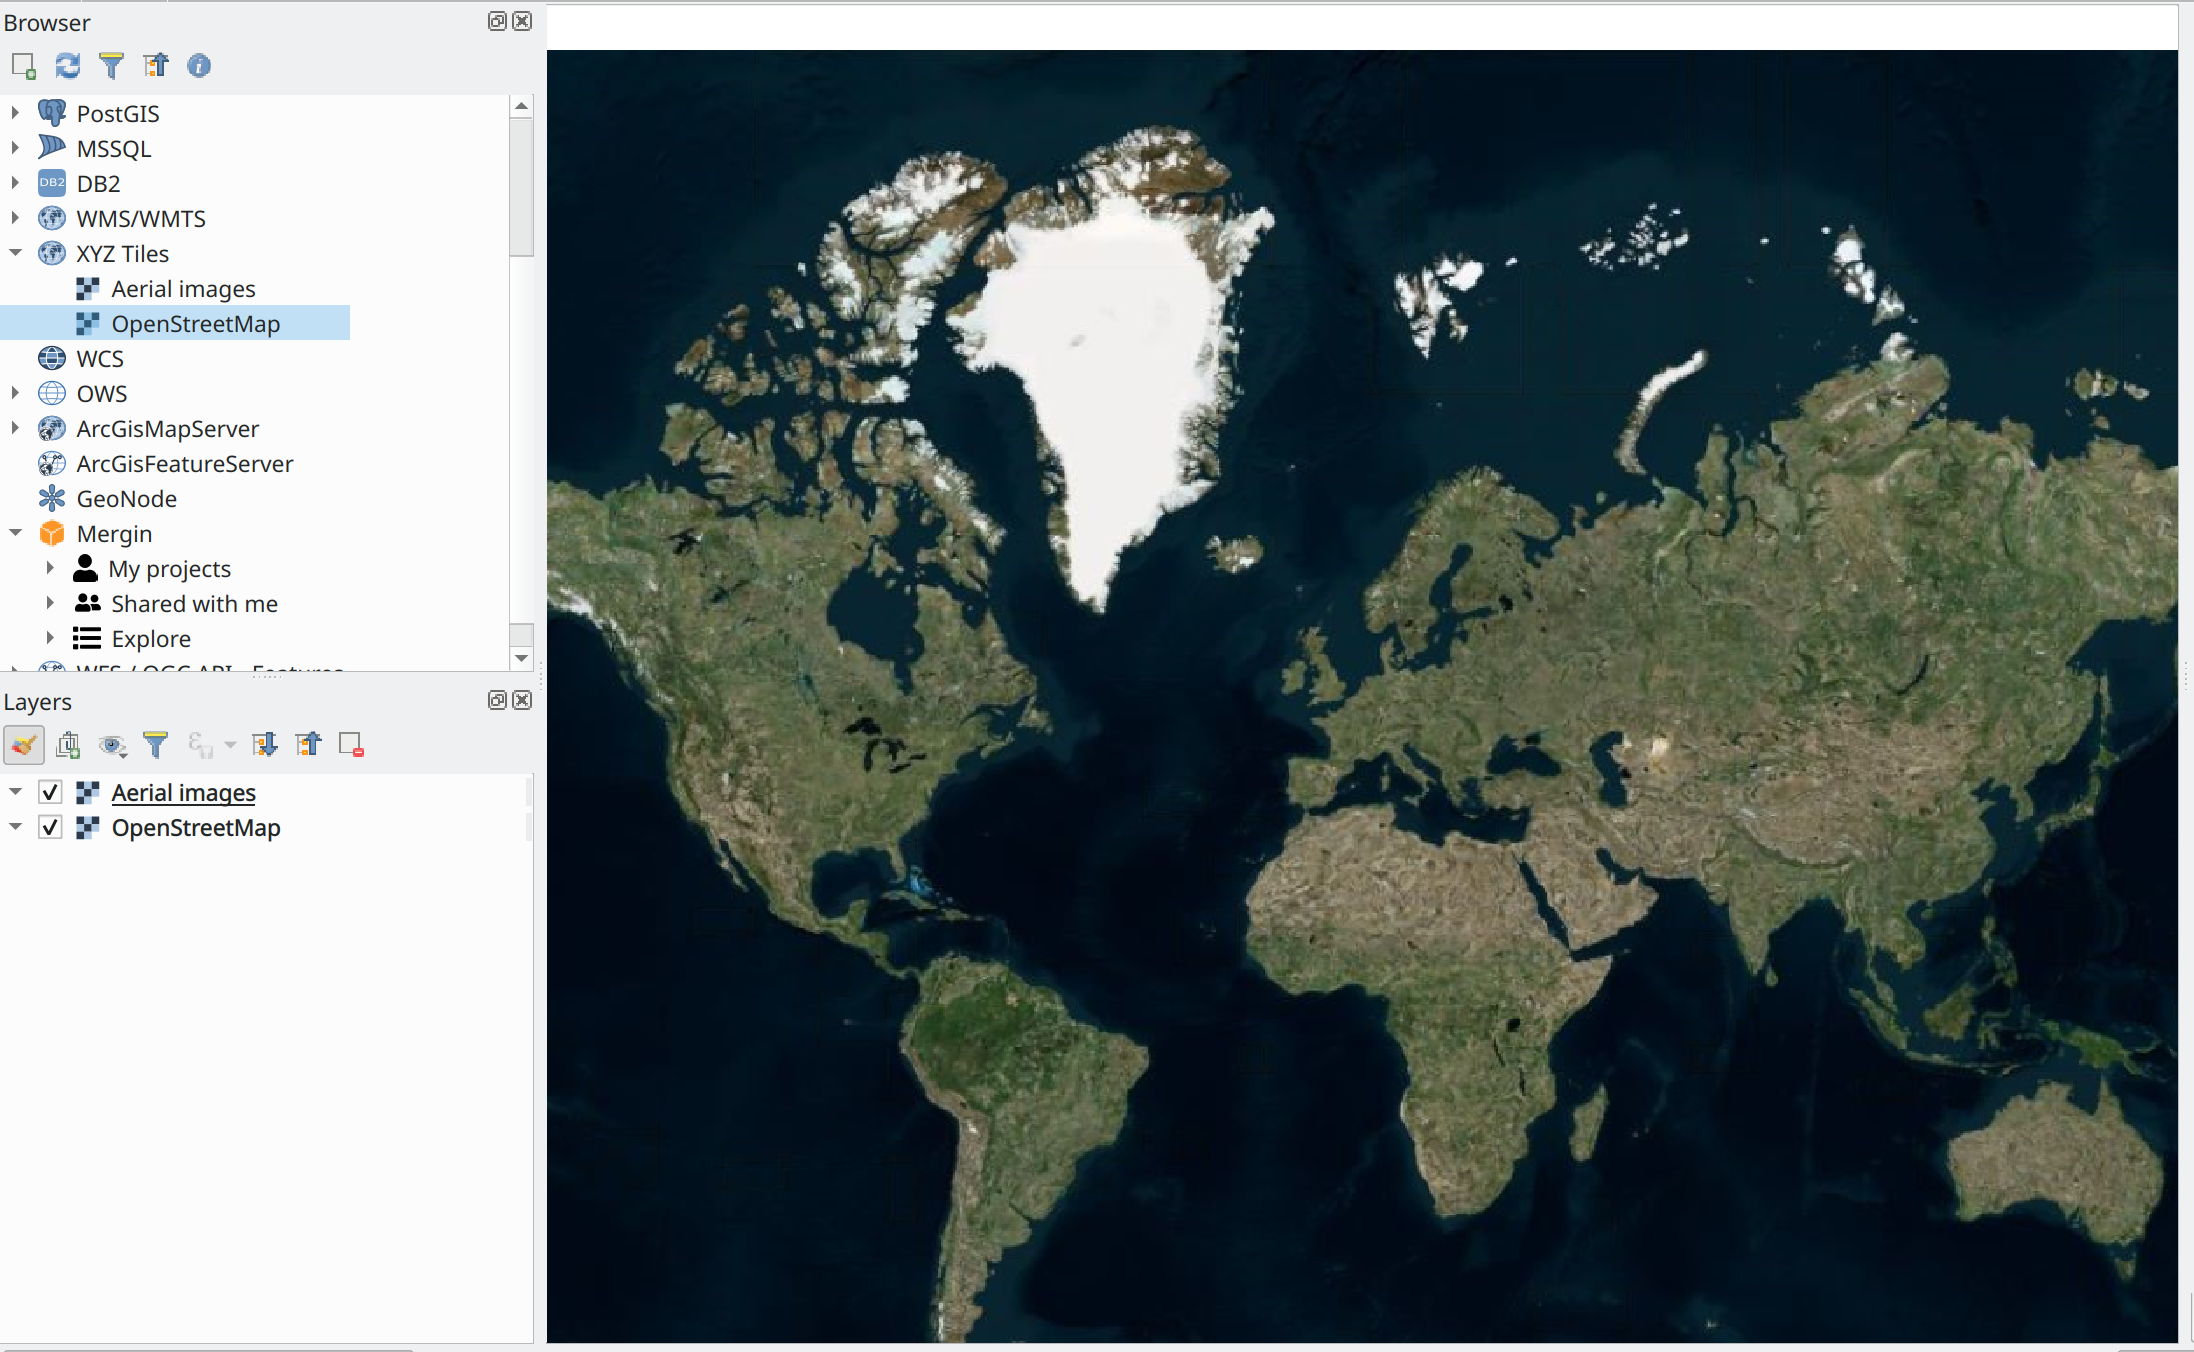
Open QGIS from your PC/laptop. From the Browser panel (usually located on the top left side), expand XYZ Tiles and double-click on OpenStreetMap to add it to QGIS:
You should see the OSM layer:
Save your project as pothole survey in the data collection folder.
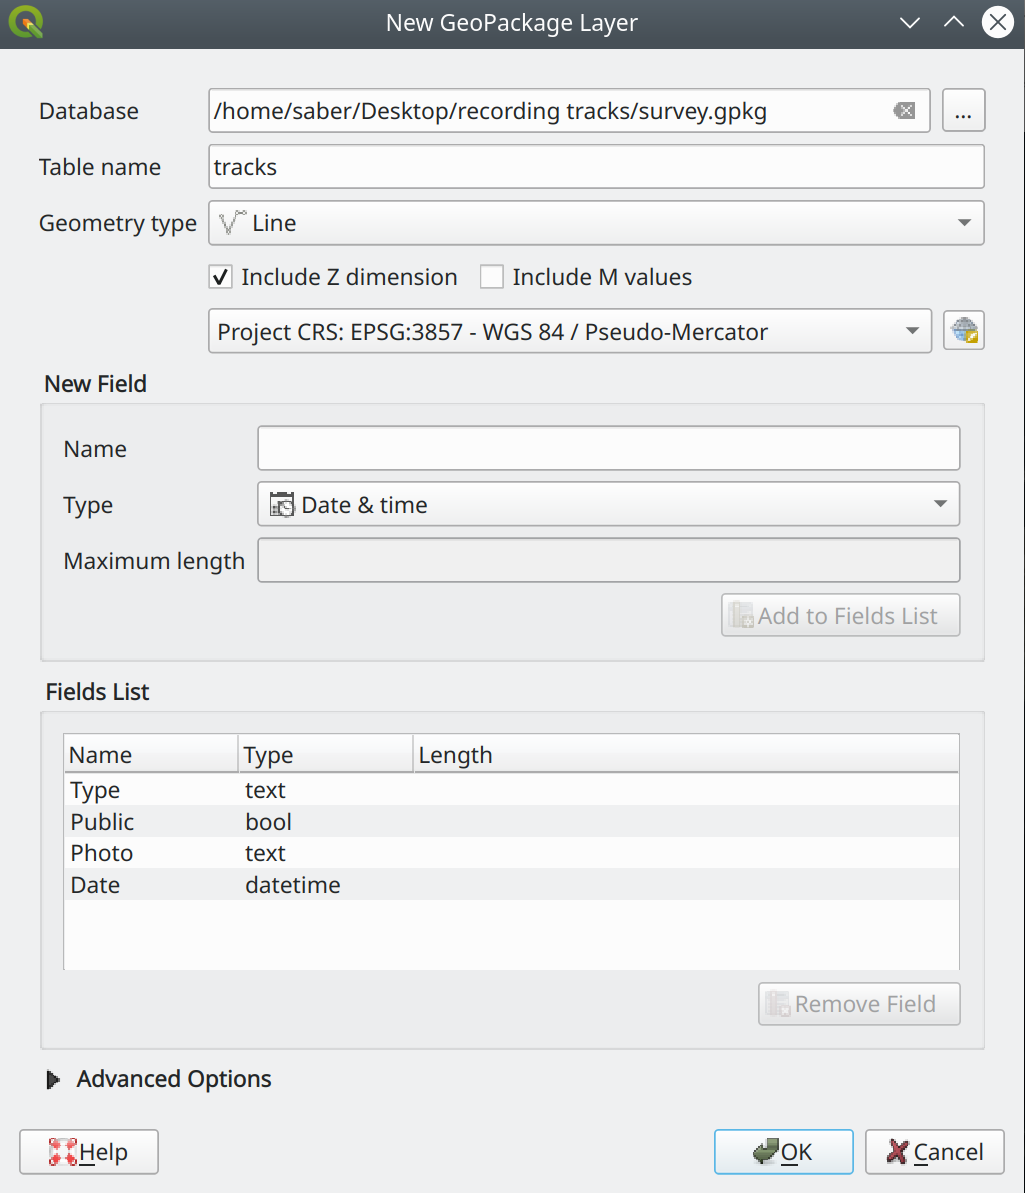
To create a survey layer, in QGIS, from the main menu select Layer > Create Layer > New Geopackage Layer …. Note that Geopackage is a file based database where you can store multiple tables (spatial or non-spatial). A new window will appear:
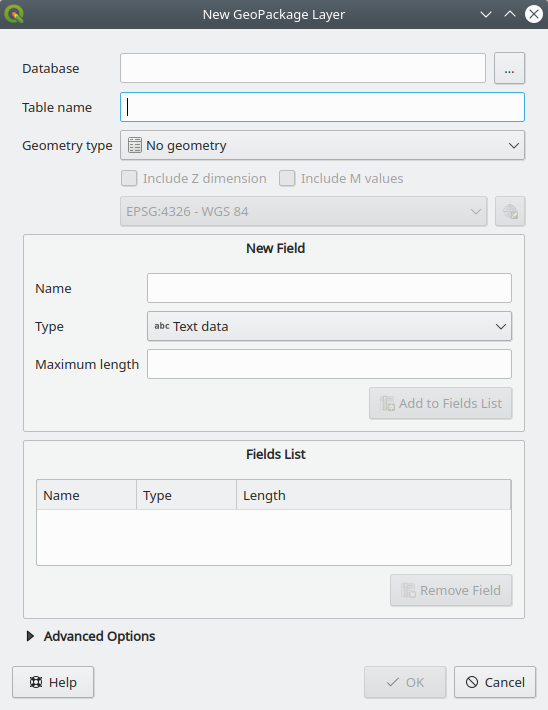
For Database click on … and select the data collection folder on your Desktop and then type survey-db.gpkg for the name of your database.
For Table name, type Potholes.
For Geometry type, select Point.
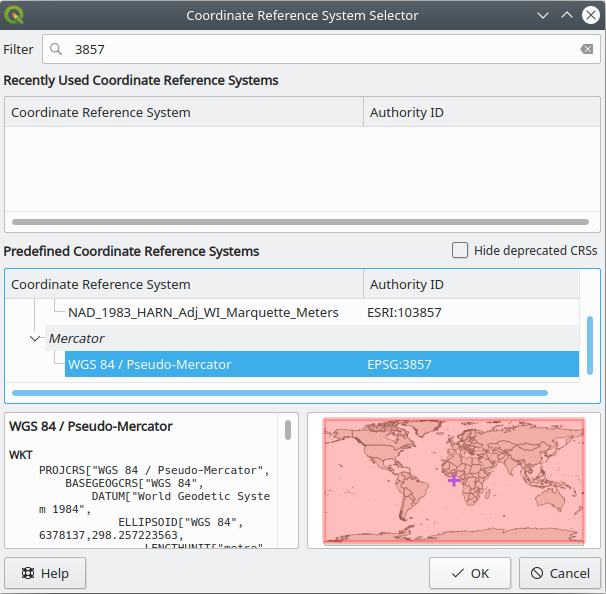
For Coordinate Reference System (CRS), click on the icon to the right of EPSG:4326 - WGS84. A new window will appear. Under Filter section on the top of the window, type: 3857 and under Predefined Coordinate Reference Systems, select WGS 84 / Pseudo-Mercator EPSG:3857. Then click OK.
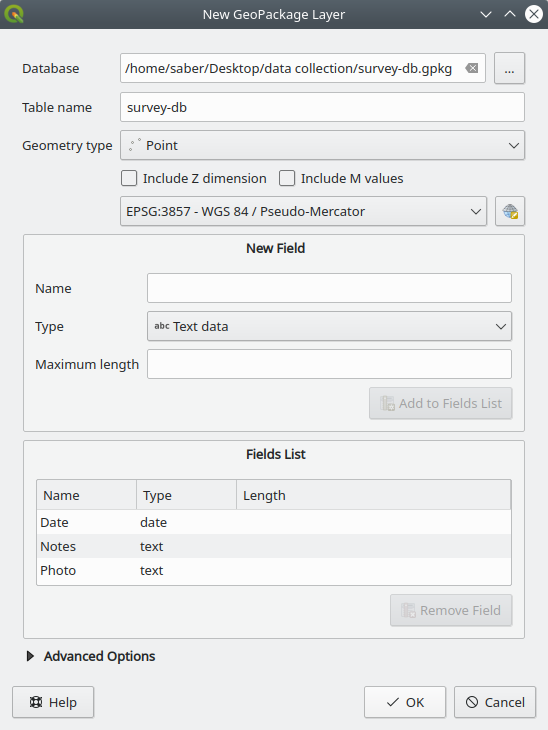
We can now create the column headers for our table under New Field section. For this form, we want to create the following columns to store data: Date, Notes, Photo
For Name, type Date
For Type, select Date
Click on Add to Field lists to add your column.
Repeat the same process for Notes and Photos columns, but make sure to change the Type for those columns to Text. At this stage, you should see an image similar to the one below:
Go ahead and click OK to create the layer and add it to QGIS.
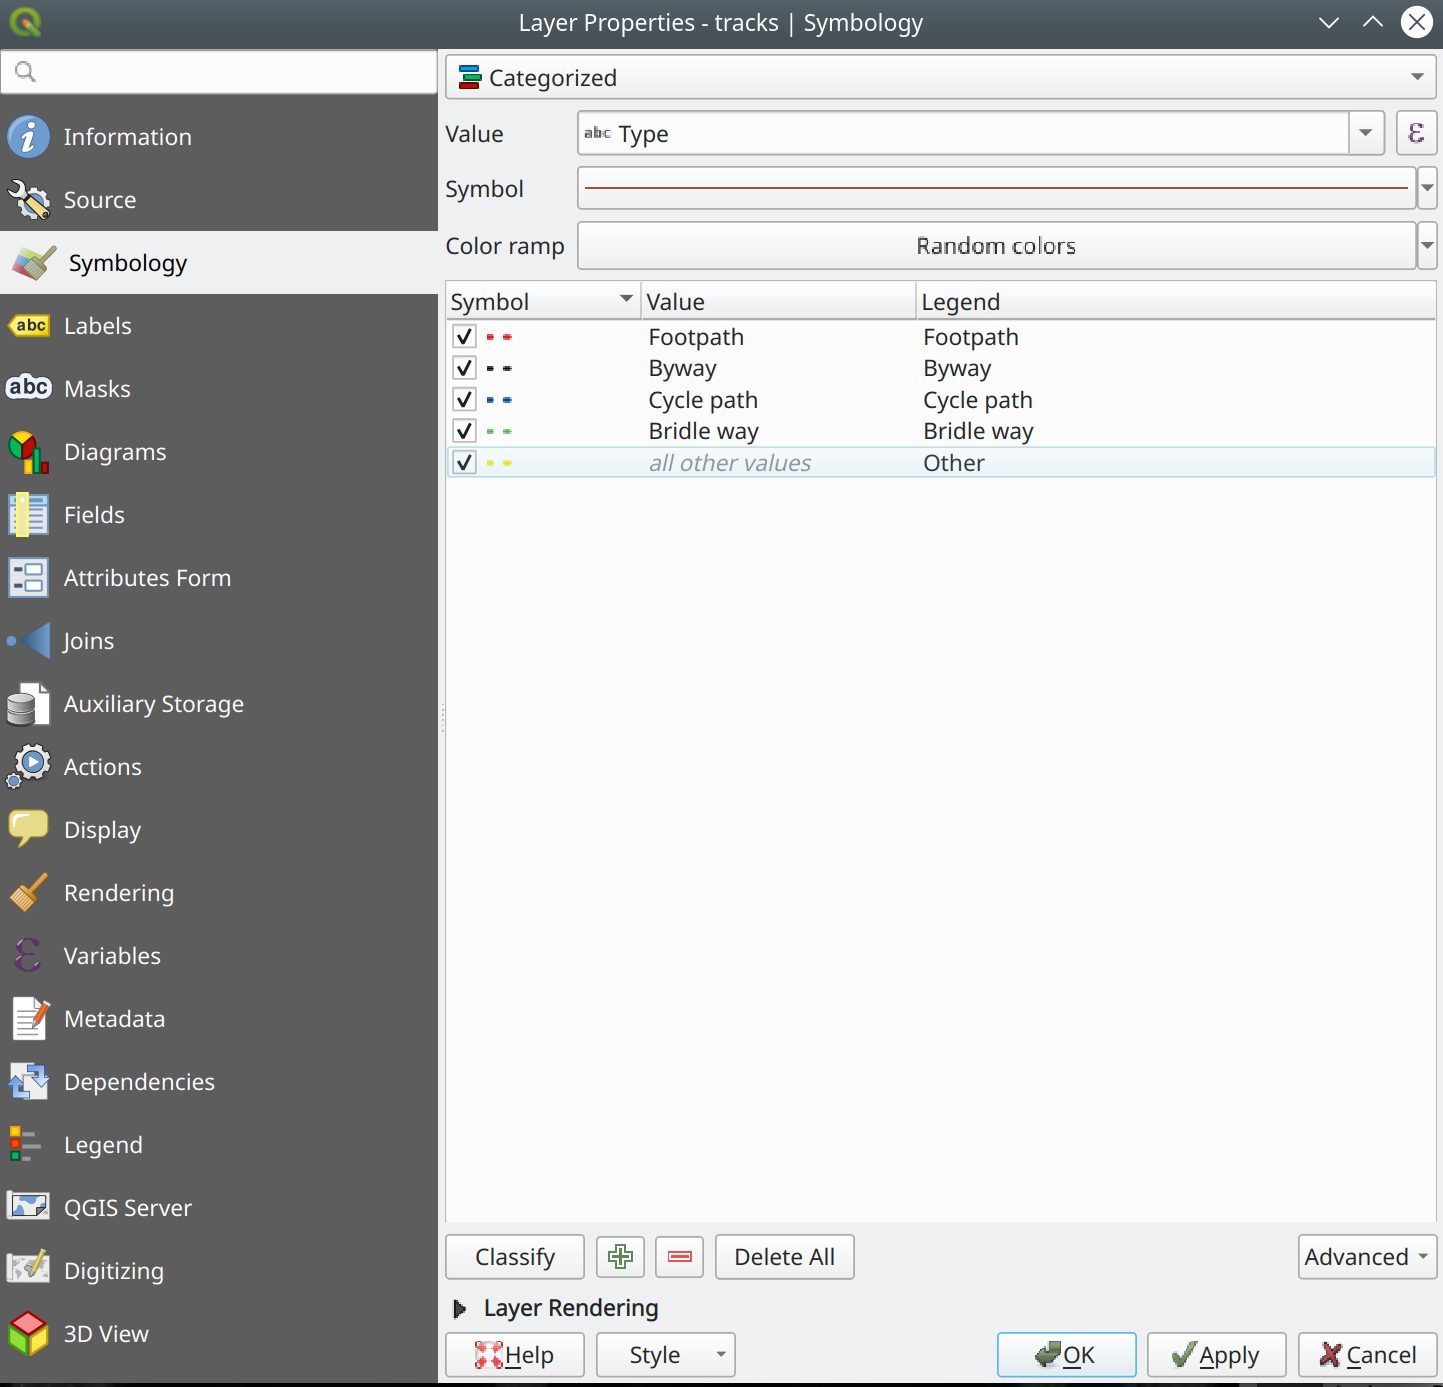
The default style applied to Potholes layer is not very visible probably. To change it:
In the Layer Panels right-click on Potholes layer and select Properties. A new window will appear. From the left panel, select Symbology. Try to change the style to something shown in the image below:
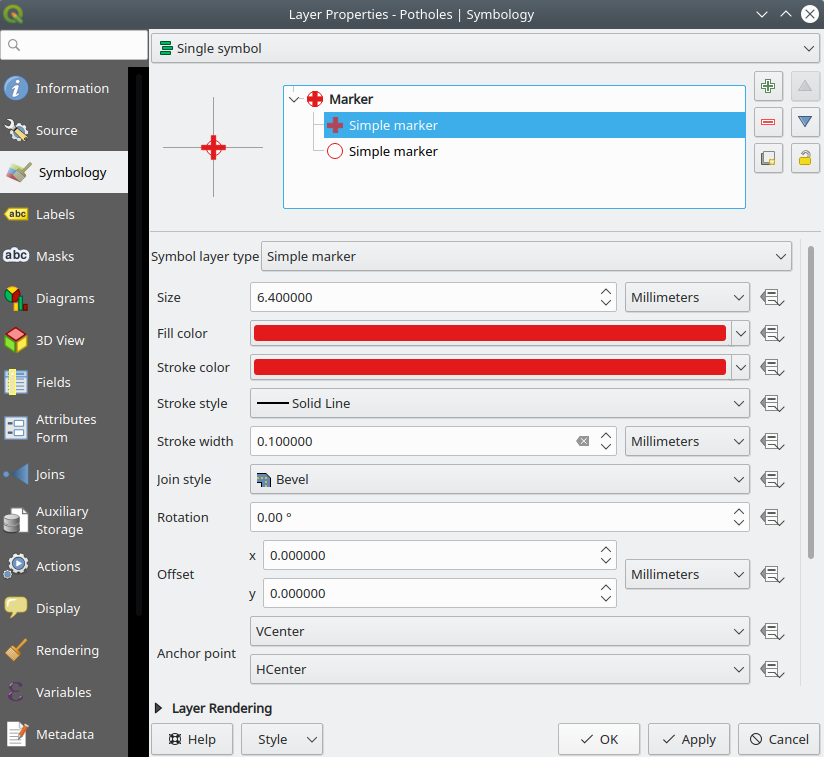
Click on Apply.
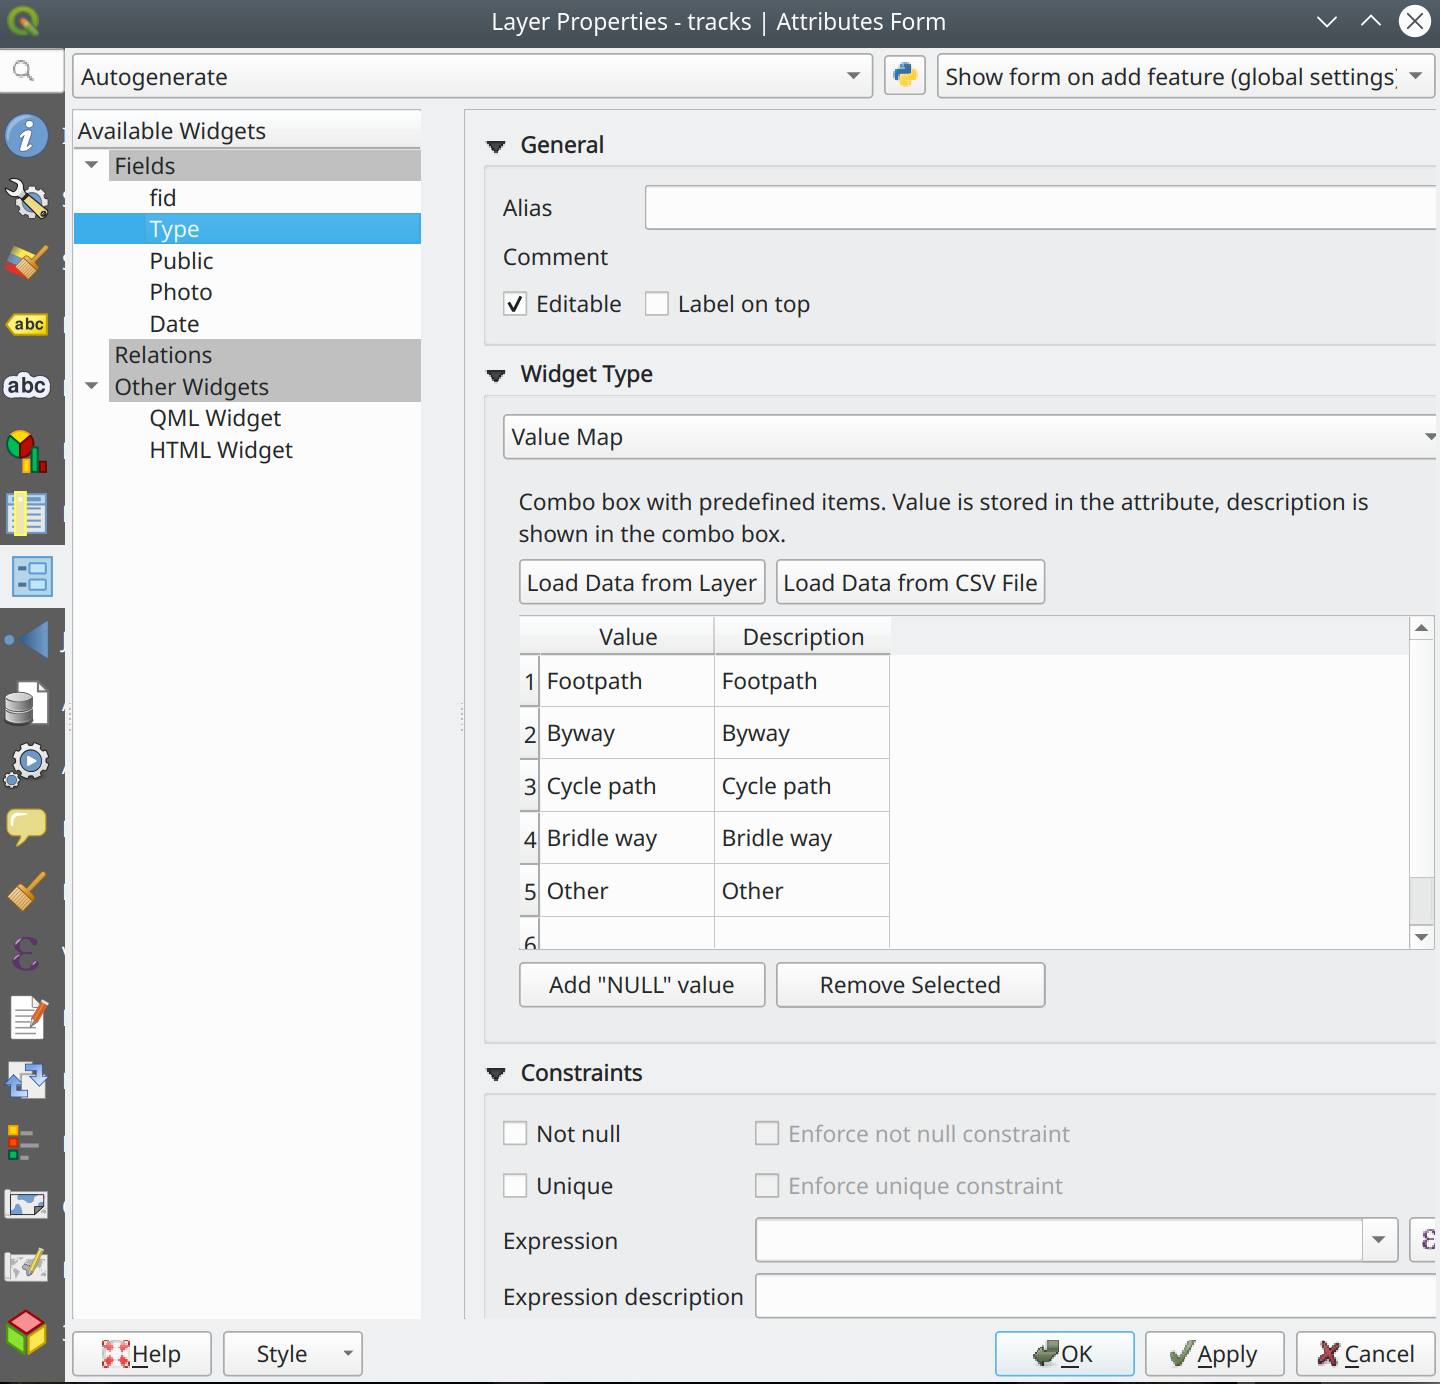
We can also change the way user fills in the form. By default, you have to type in the values. But by using different widgets, we can simplify filling the form in the field.
In the Properties window, from the left panel, select Attribute forms.
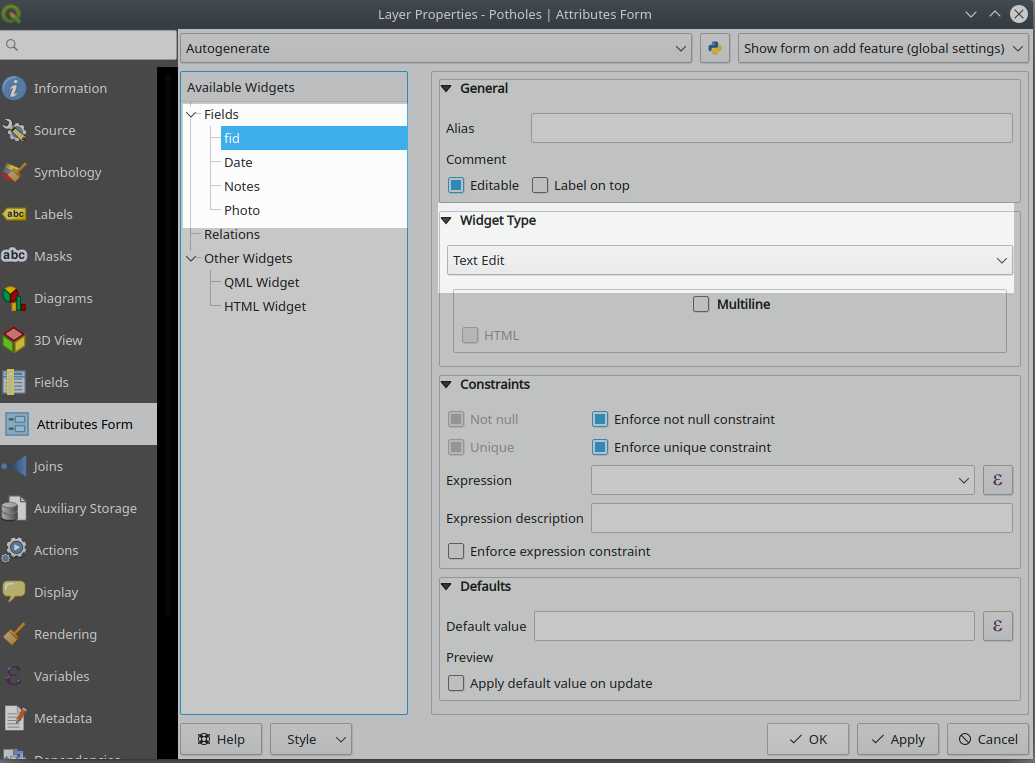
We are going to change the Widget Type for each of the Fields.
fid is an auto-increment field and we can keep it hidden from users. So, highlight the fid field under Field section and then from the Widget Type select Hidden
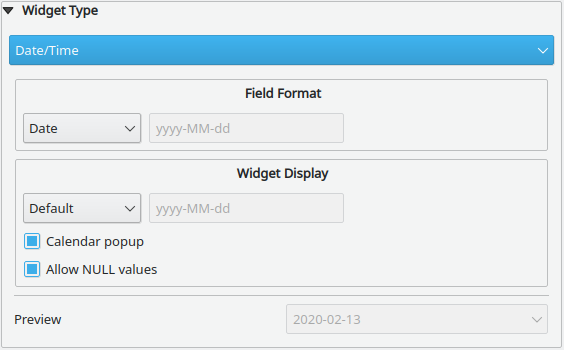
For Data, it should have automatically selected the correct widget type:
For Notes, you can also leave the Widget Type as Text Edit.
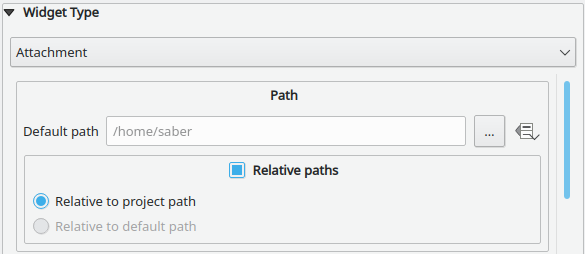
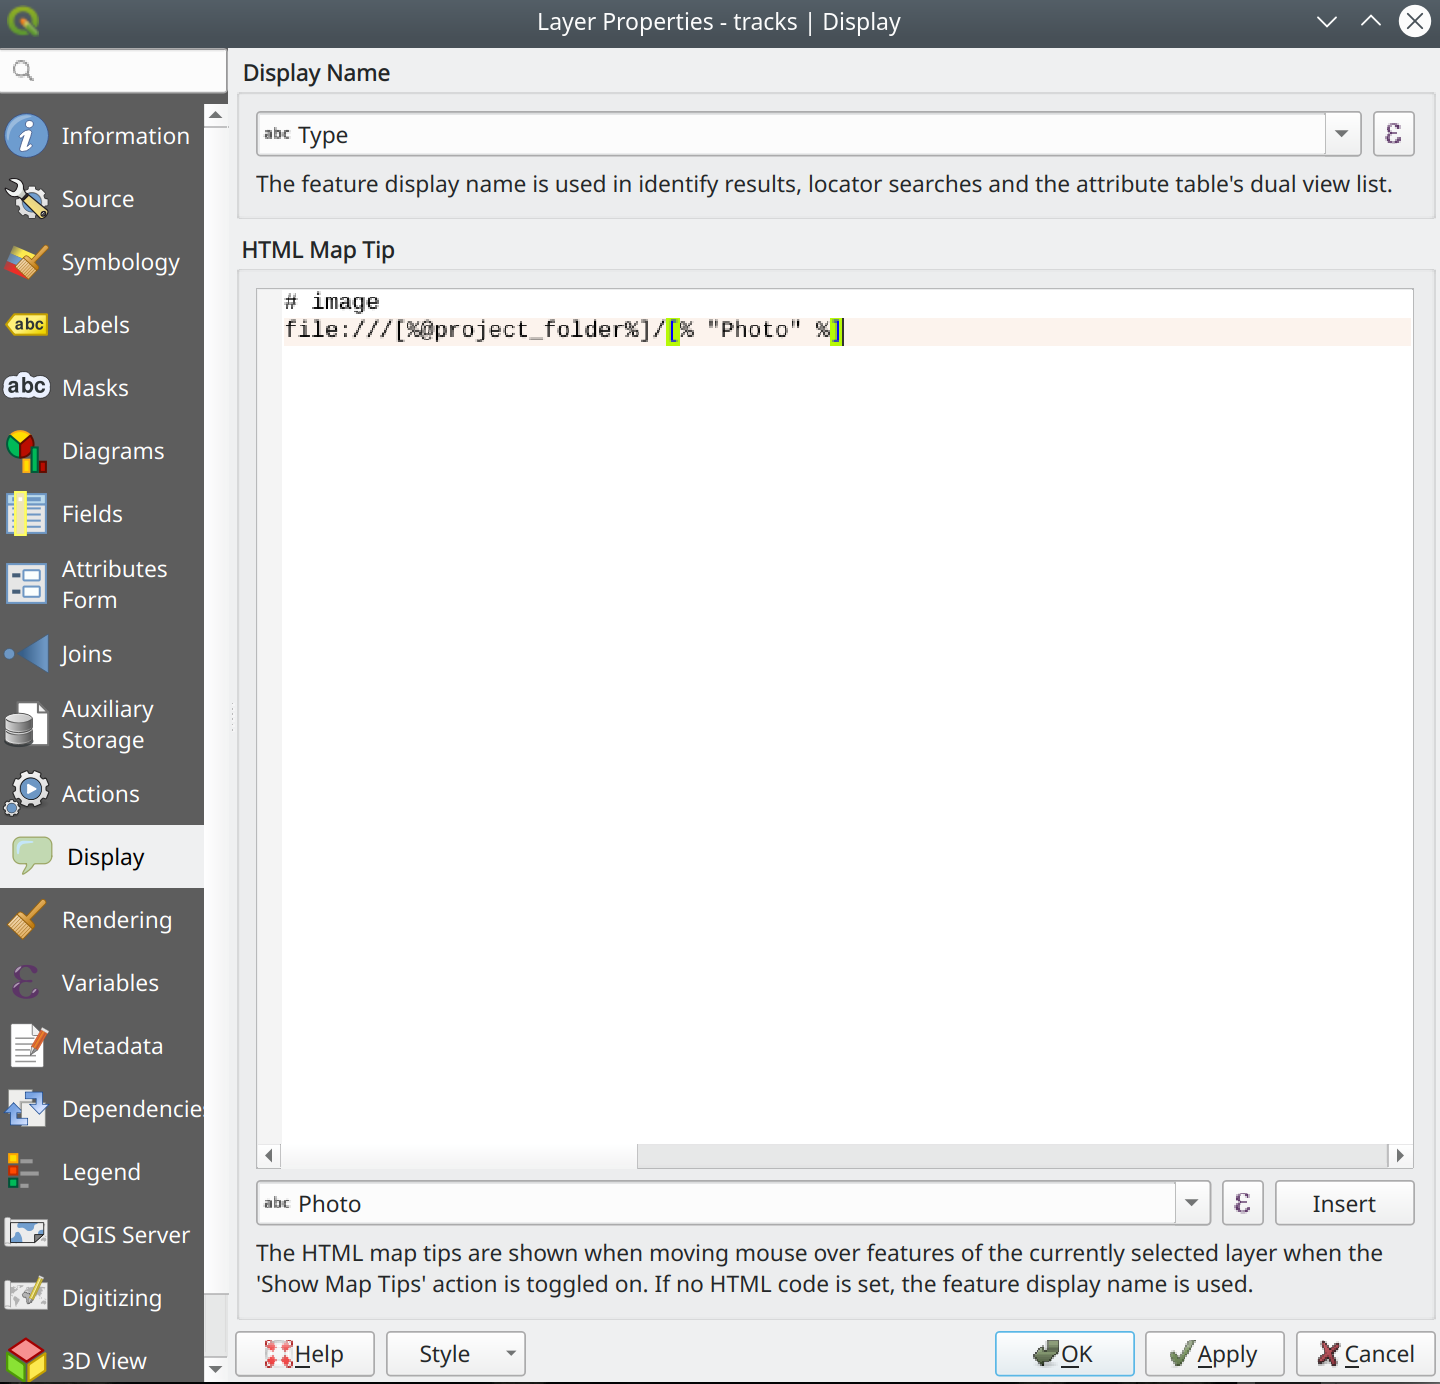
For Photos, we need to change the Widget Type to Attachment. Also make sure to select the option for Relative paths. This will allow us to attach photos using mobile camera or gallery folder to the pothole point.
Tip: You can scroll further down and under Integrated Document Viewer and select Type as Image. This will show the image in QGIS forms too.
Project set up is completed and we can save the project.
Transferring data to mobile devices
You have 2 options to transfer your data to the mobile through the Mergin service: through website or through Mergin plugin in QGIS. In this tutorial we are going to use the plugin from within QGIS.
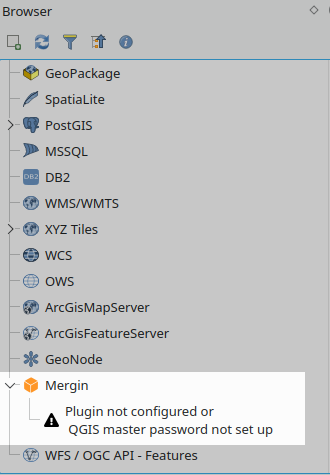
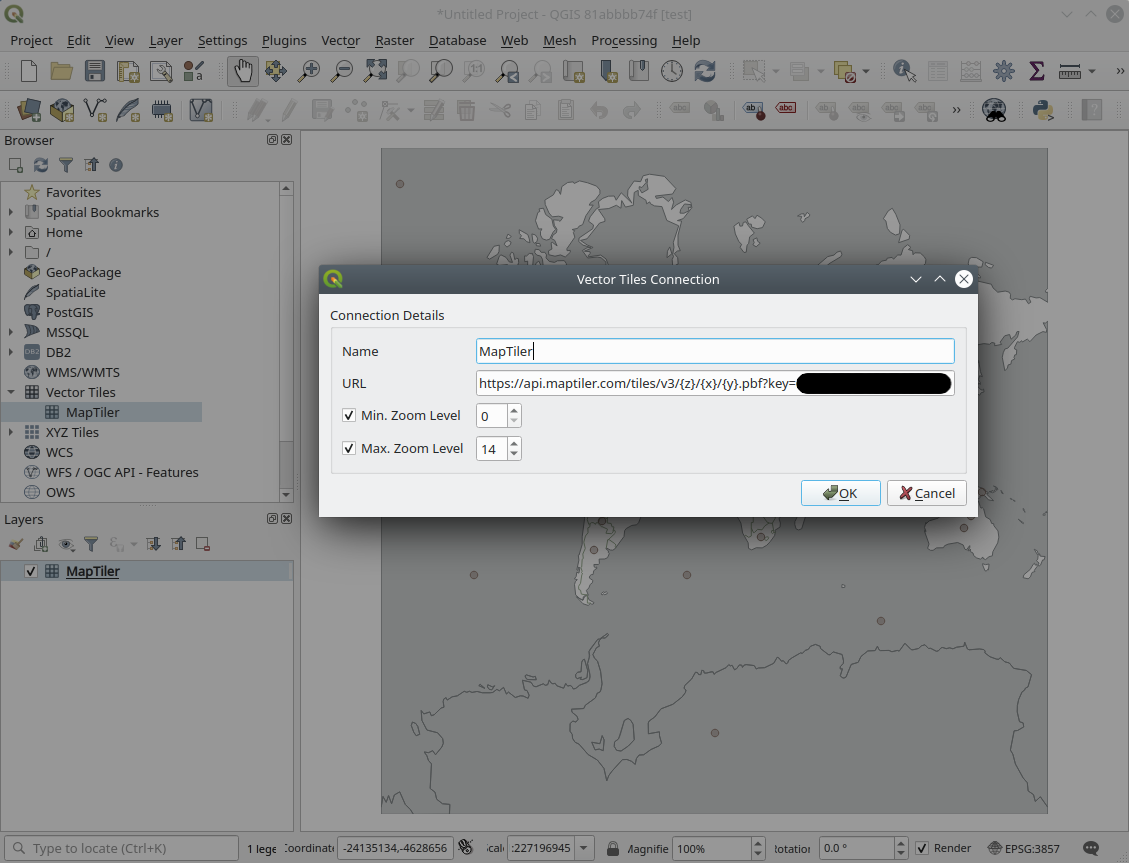
In QGIS, from the main menu, select Plugins > Manage and Install Plugins …. A new window will appear. From the left panel, select All and then in the search section (on the top) search for Mergin. Select the plugin from the list and click on Install plugin. After installation, you need to restart your QGIS.
After the restart, you should be able to see the Mergin icon in your Browser Panel:
In the Browser Panel, right click on the Mergin and select Configure. Type in your username (or email address) and password that you have registered with the Mergin service.
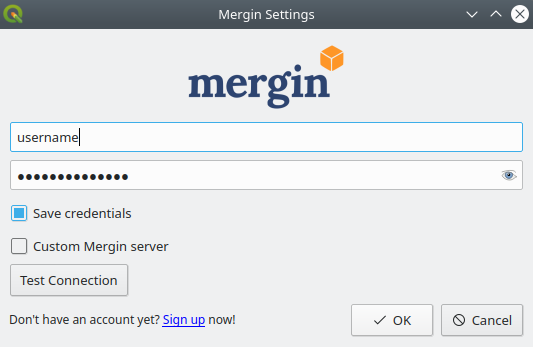
Click on Test Connection and you should see a green OK.
If you have selected to Save credentials (so you do not need to type in the username and password again) and you have not configured QGIS password manager, you will be prompted to set a password for your QGIS password manager.
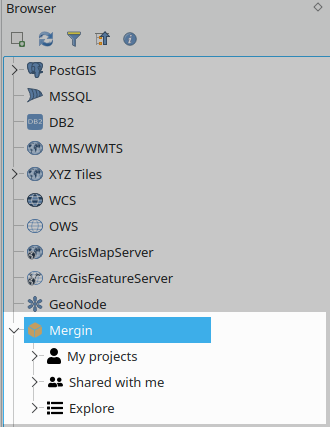
After clicking OK, you should see a list of folders on your Mergin connection in your browser panel:
We can know upload the data:
Right click on the Mergin and select Create new project. A new window will appear:
For Project name type Potholes survey
Select Initialize from local drive
Click on … and and select data collection folder
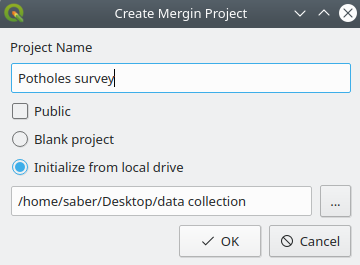
Once click OK, the project will be created and content of the data collection folder will be uploaded there.
The project is now ready to be downloaded on your mobile device.
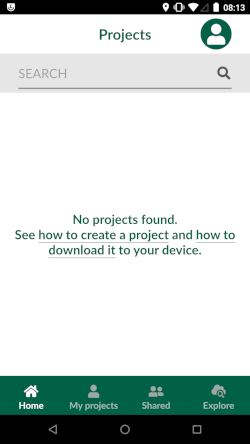
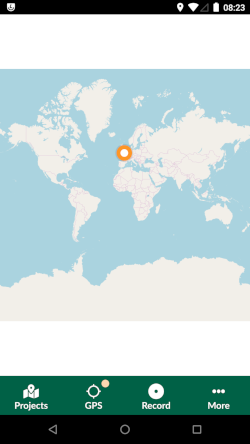
The project can now be accessed from Input app. Open your Input app and for the first time you should see a screen similar to the image below:
To log in to the Mergin service, you can select My projects or the green and white icon on the top right.
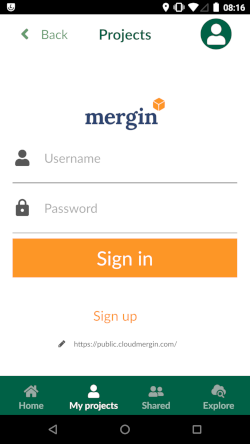
Type your Mergin username (or email address) and password and then select Sign in.
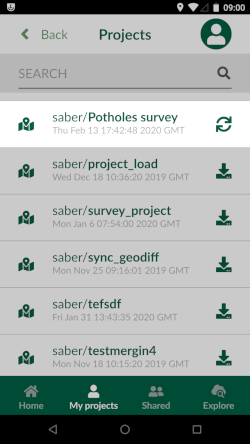
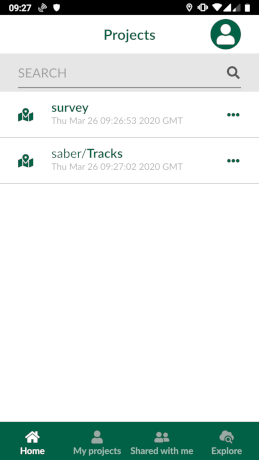
Once signed in, select My projects and you will see Potholes survey project in the lists
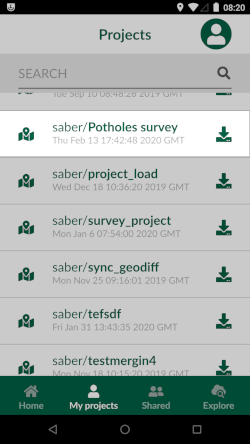
Select the download icon on the right side of Potholes survey to download your project on the phone and make it ready for survey.
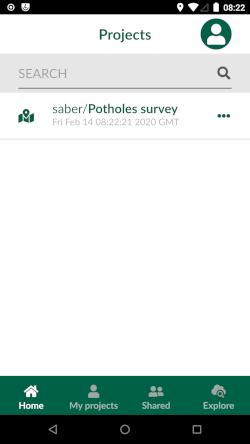
After downloading is completed, select Home and you should be able to see Potholes survey.
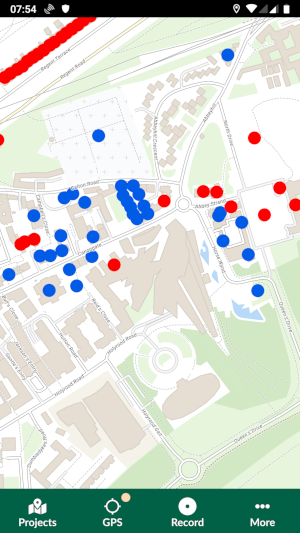
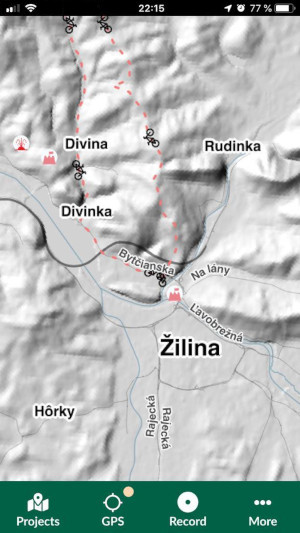
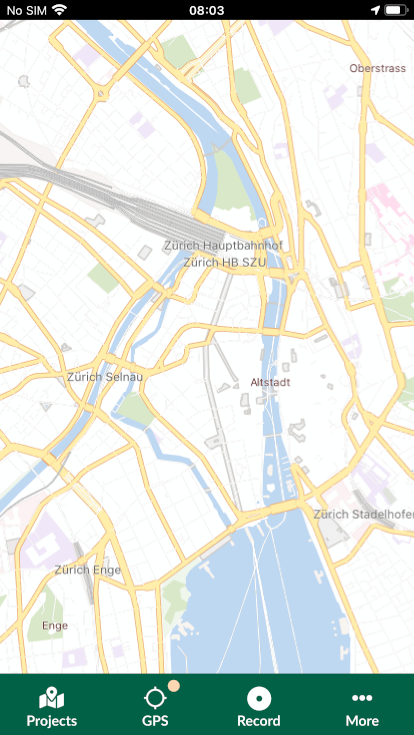
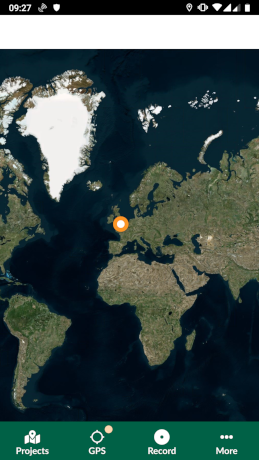
Select Potholes survey and it will open the map:
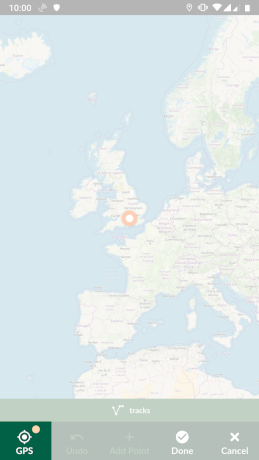
To record a feature, select Record button and the pointer changes to a cross-hair.
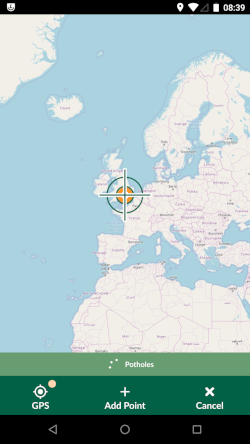
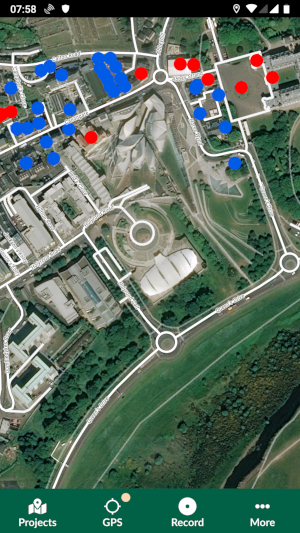
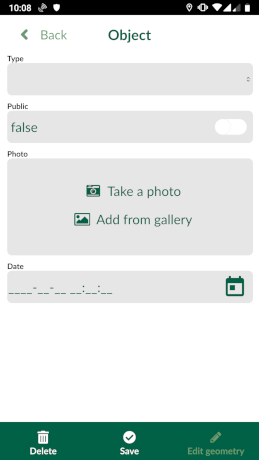
By default, the cross-hair centres to your location (the orange point) on the map. You can move the map and adjust the location. To recentre the map to your location, you can select GPS button. Once you are happy with the location, you can select Add point and the form for your point will appear:
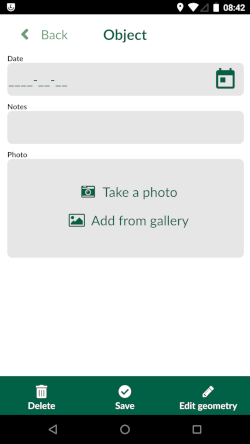
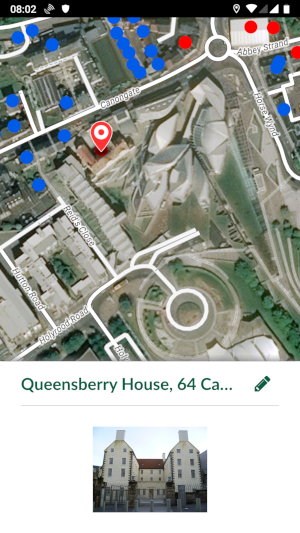
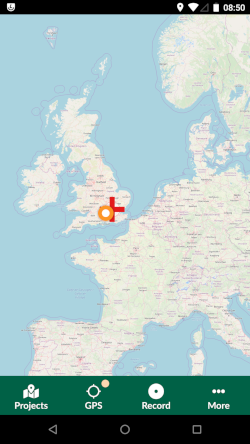
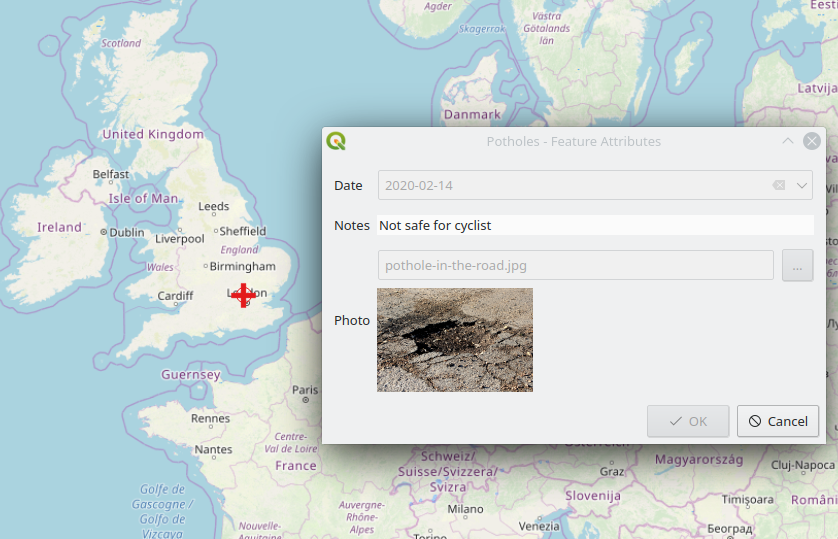
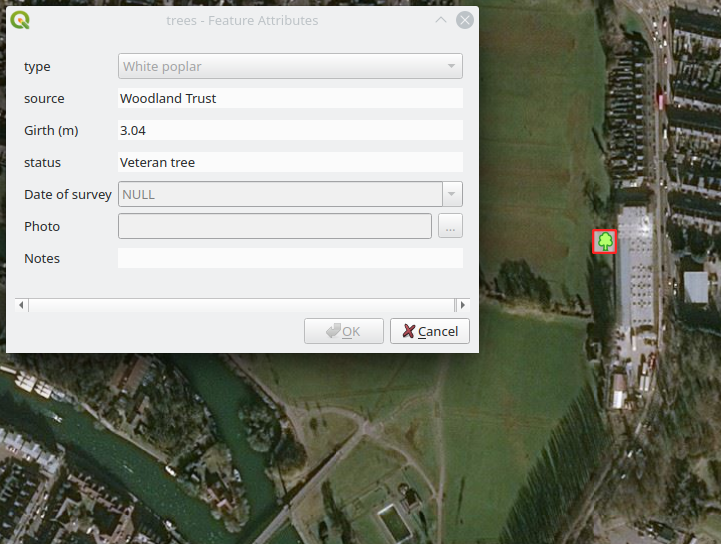
Fill in the form and press Save. You should see the map with the newly captured pothole:
Synchronising data
The data you have captured on your phone can be synchronised through the Mergin service.
In Input app, select Projects and then My projects. You should see a double arrow on the right side of the Potholes survey.
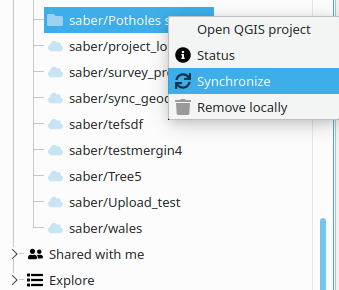
Select the double arrow to sync your project. You can also open QGIS from your PC/laptop and synchronise changes back to your desktop:
In QGIS, from the Browser Panel under Mergin > My projects right-click on Potholes survey and select Synchronize
After synchronising is completed, you should be able to see the point and its associated form on your QGIS.
Further reading
Input app’s manual can be found here.
With the Mergin service, multiple users can collect data on the same project. For more information, see this the blog post.
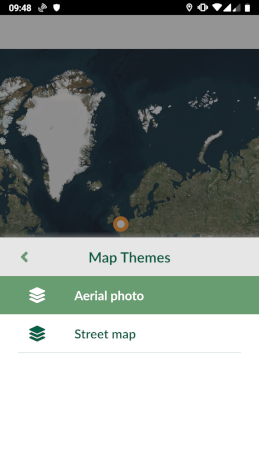
For more information on how to set up complex forms and map themes see QGIS documentation.


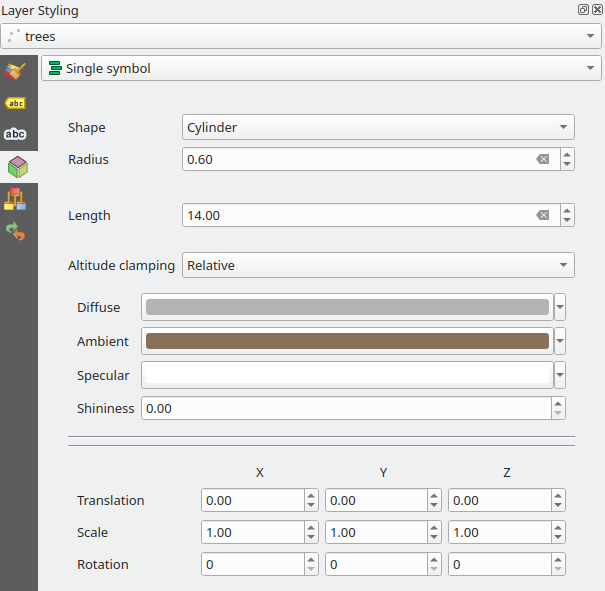
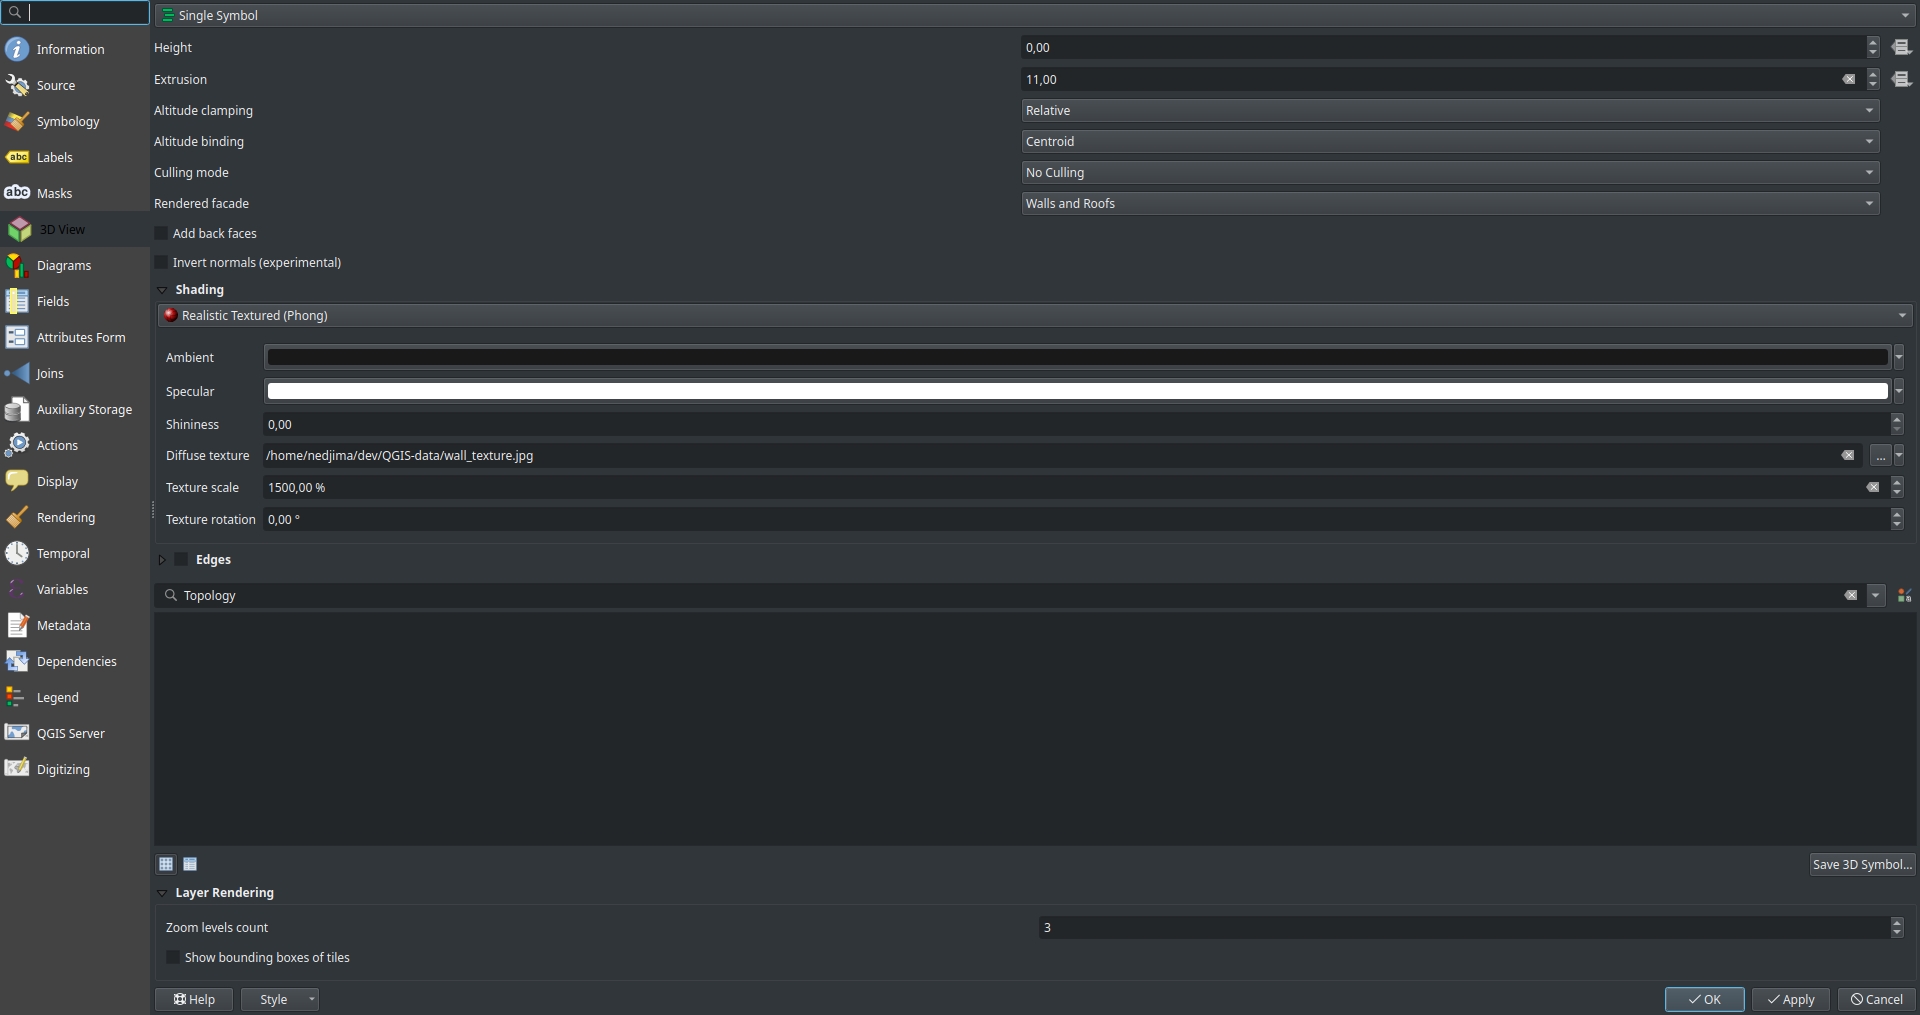 You can adjust the scale of the image and its rotation from the texture scale and texture fields respectively.
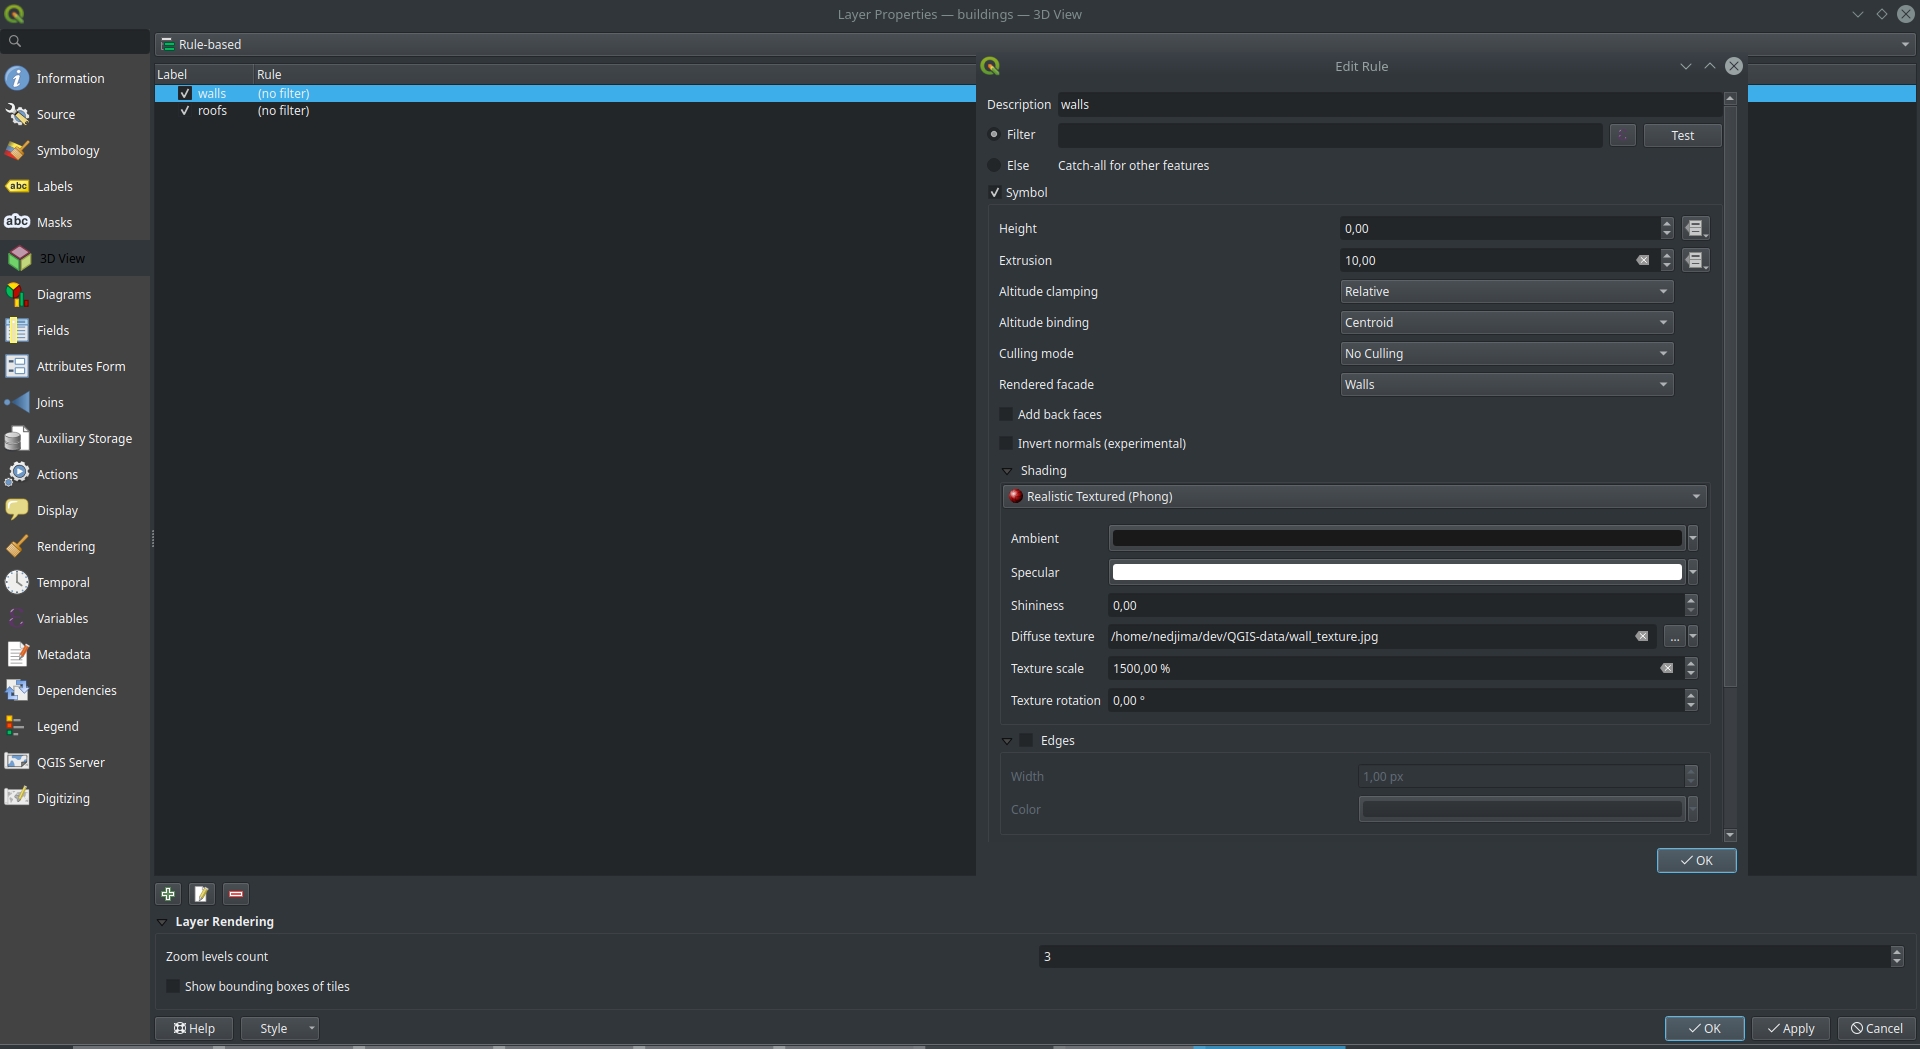
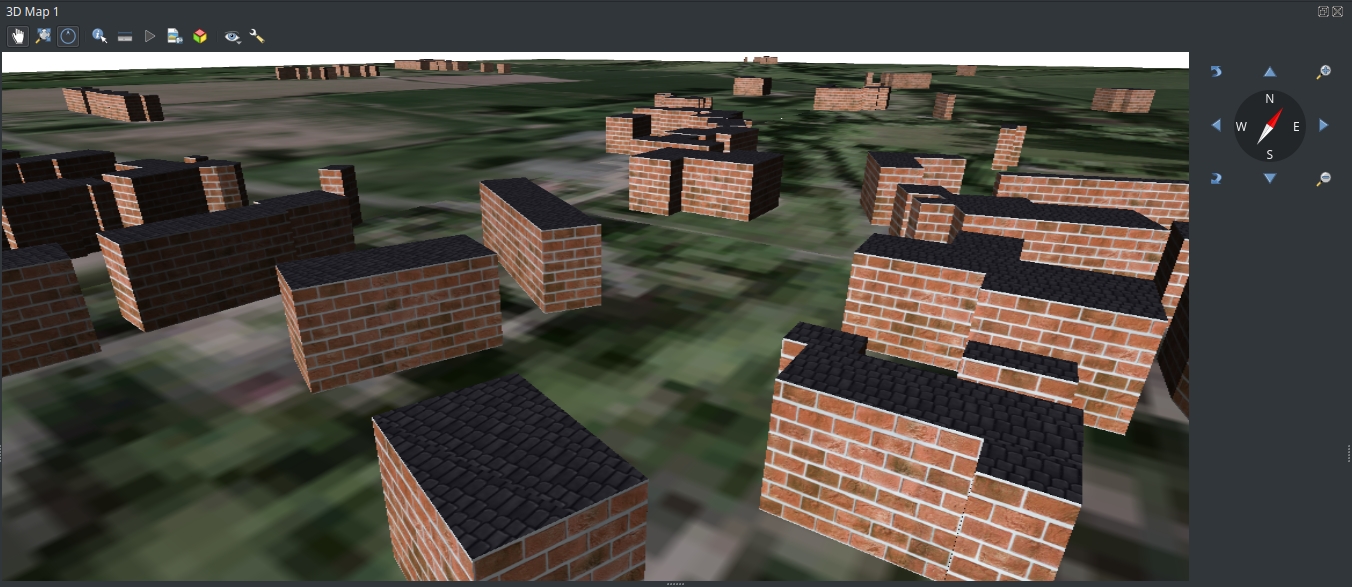
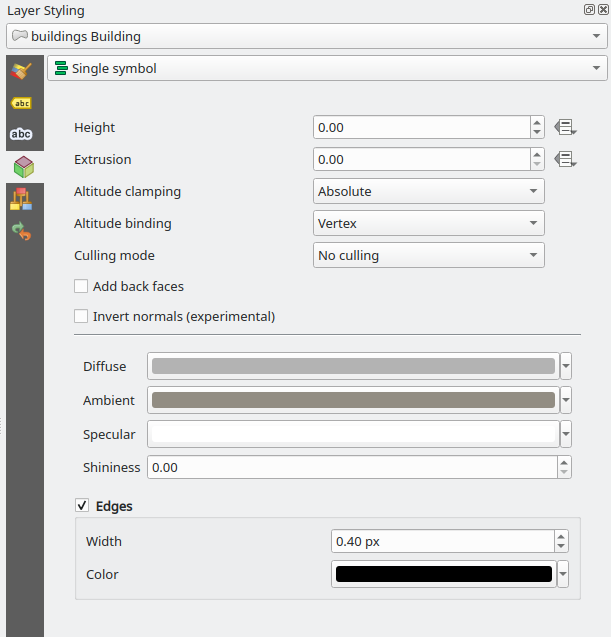
 There is a workaround to seperate roofs from walls using rule based rendering by adding 2 seperate rules and selecting which facet (roof or a wall) to display and select which rendered facade to be used and the shading setting for each rule.
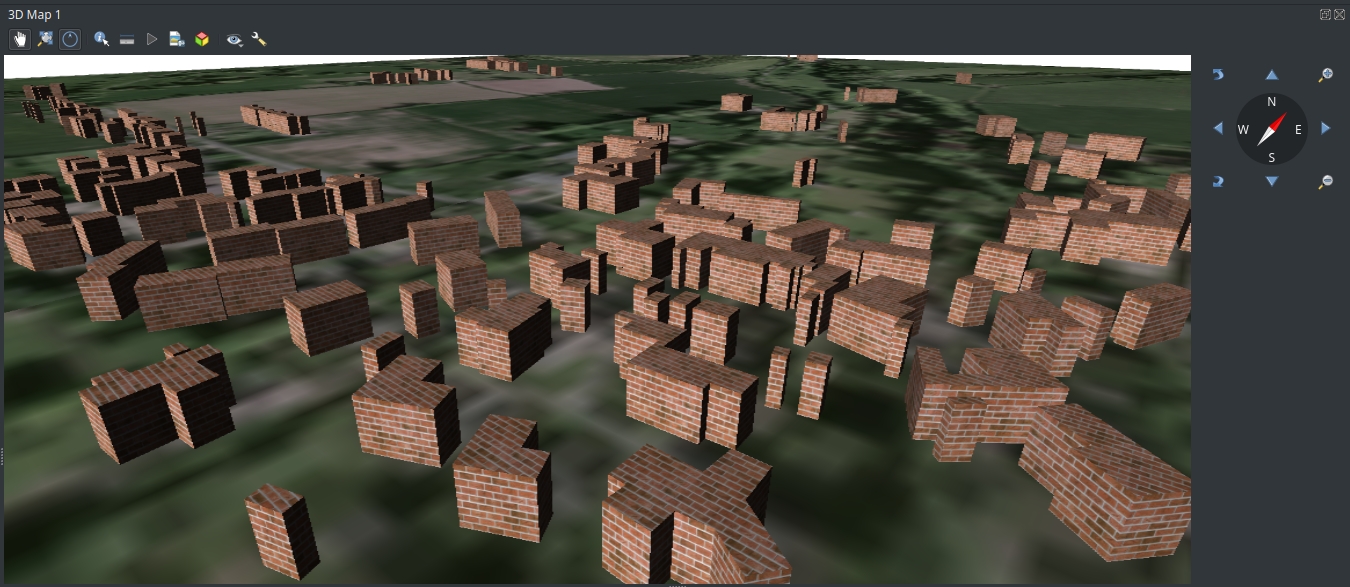
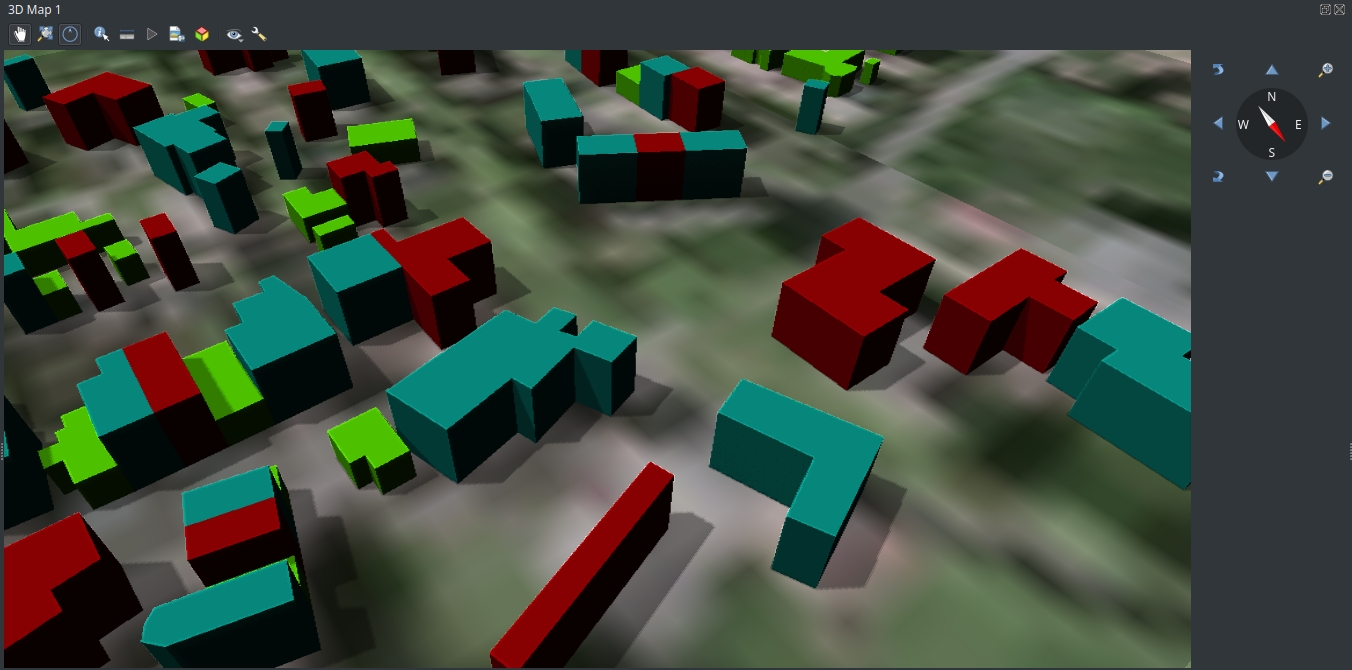
 Results for seperating roofs and walls
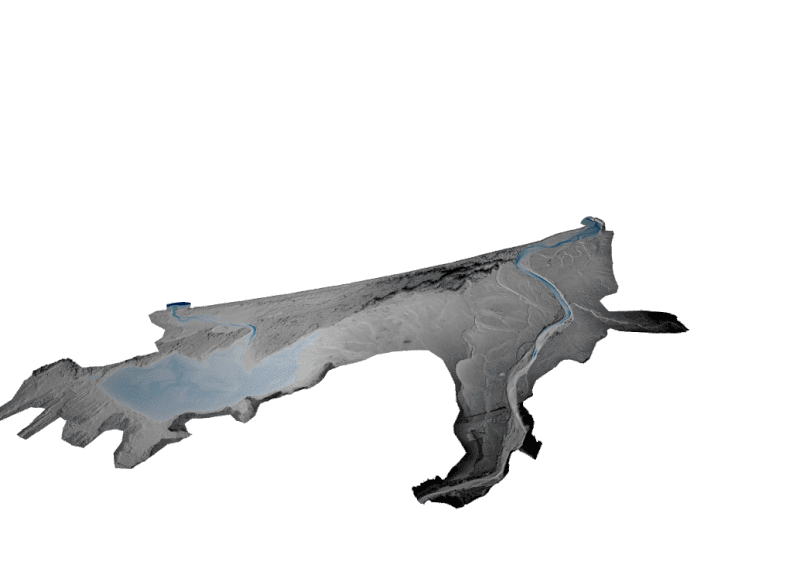
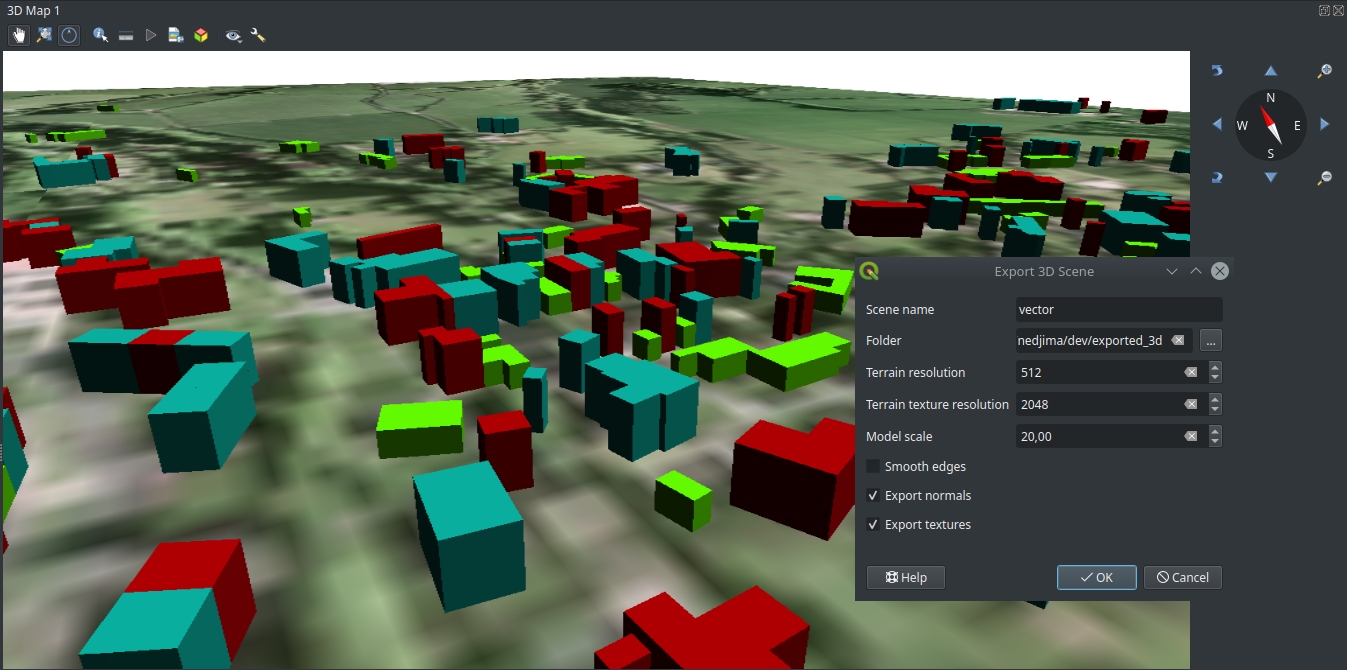 You can select the name of the .obj file and where to save it (you need to select a folder because you will have multiple files if you export textures or color informations). You can specify the resolution of the terrain in case you’re using a DEM as well as the resolution of the exported textures.
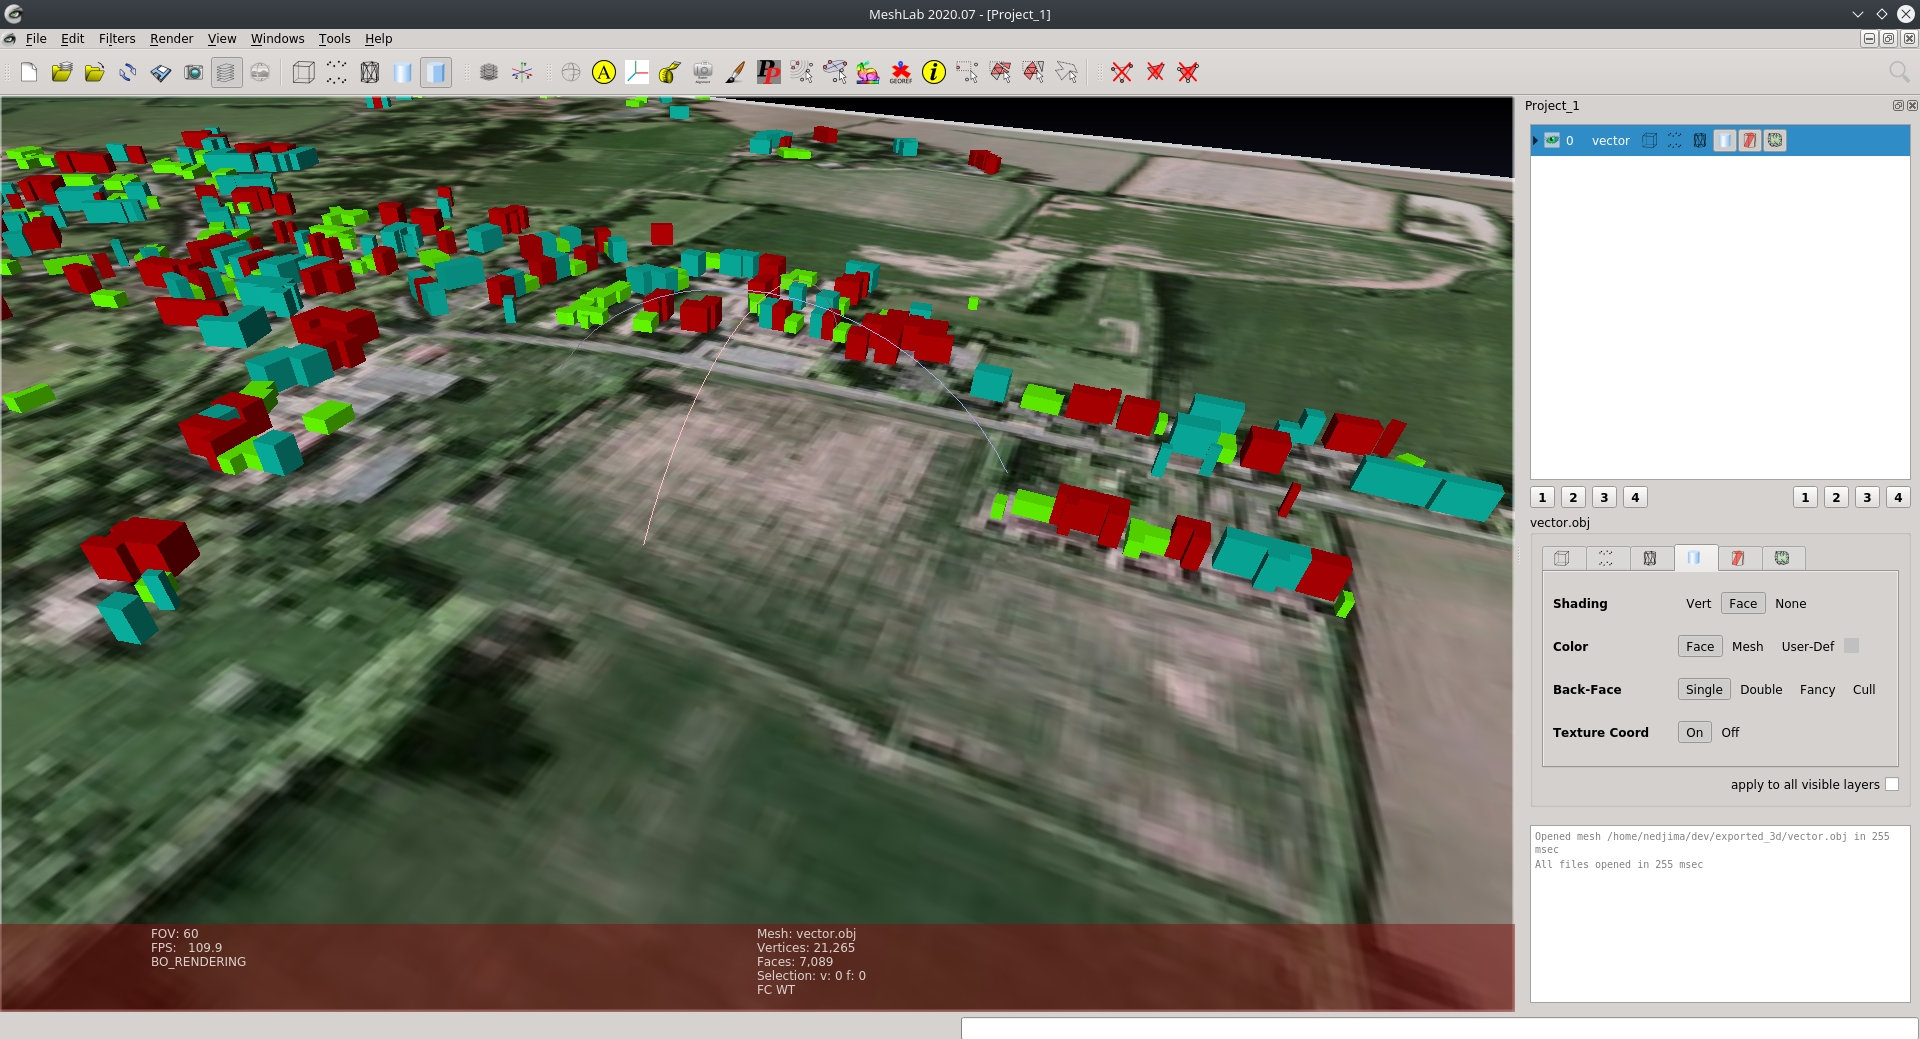
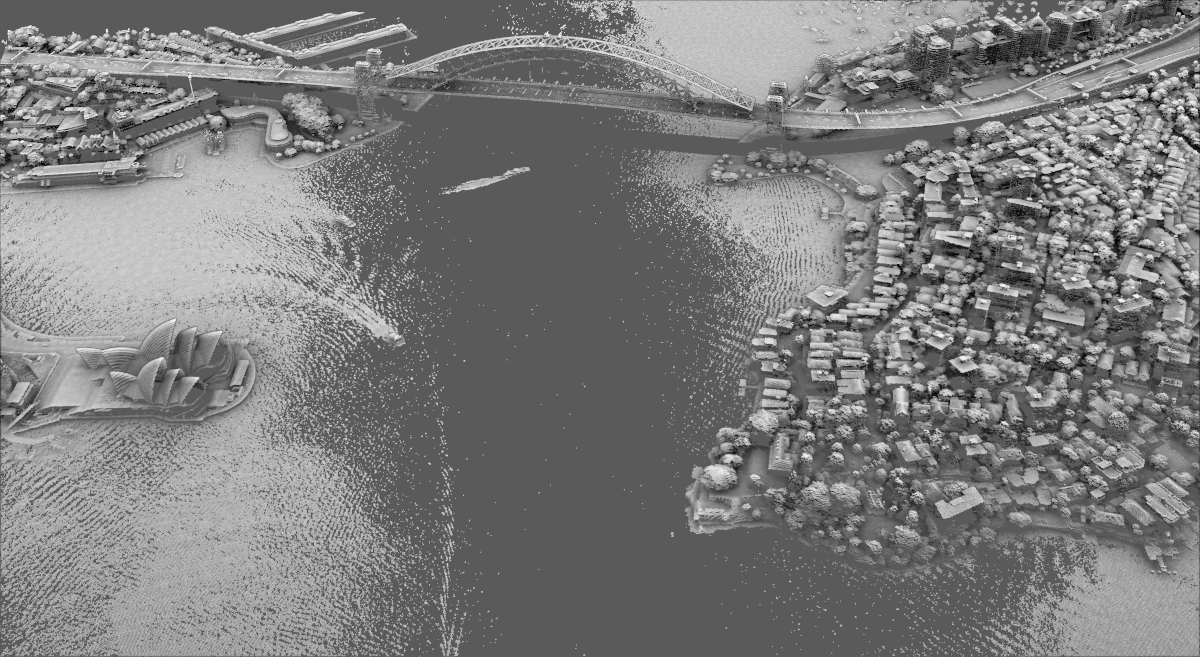
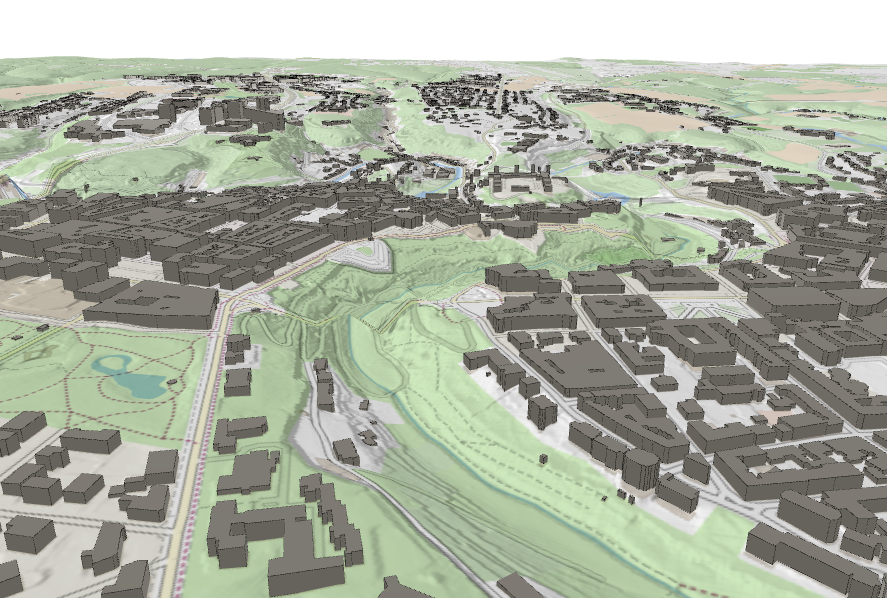
Here is a view of what an exported scene that has multiple rendering rules looks like in MeshLab:
You can select the name of the .obj file and where to save it (you need to select a folder because you will have multiple files if you export textures or color informations). You can specify the resolution of the terrain in case you’re using a DEM as well as the resolution of the exported textures.
Here is a view of what an exported scene that has multiple rendering rules looks like in MeshLab:
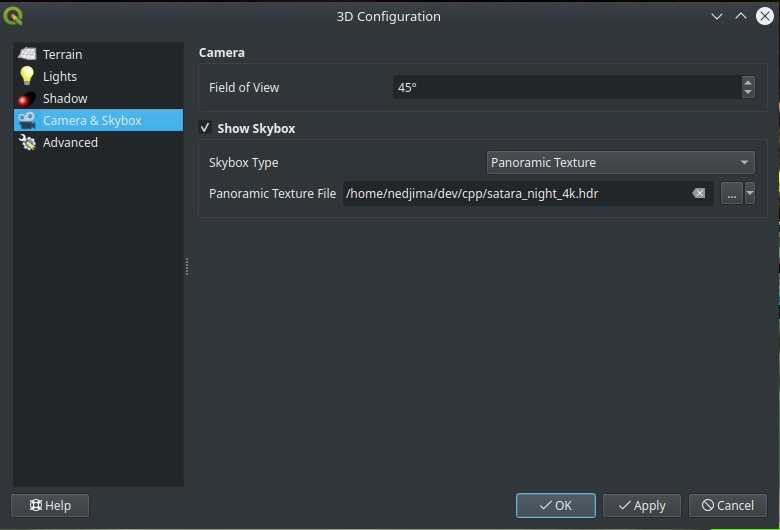
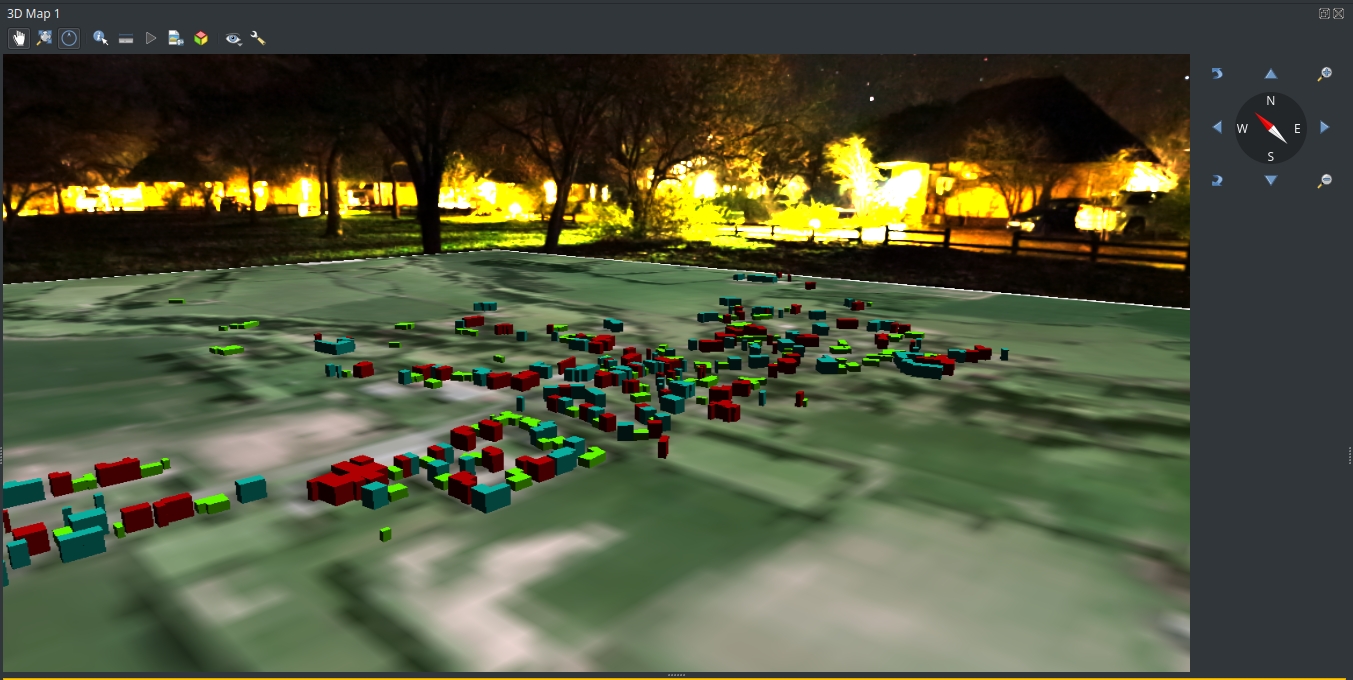
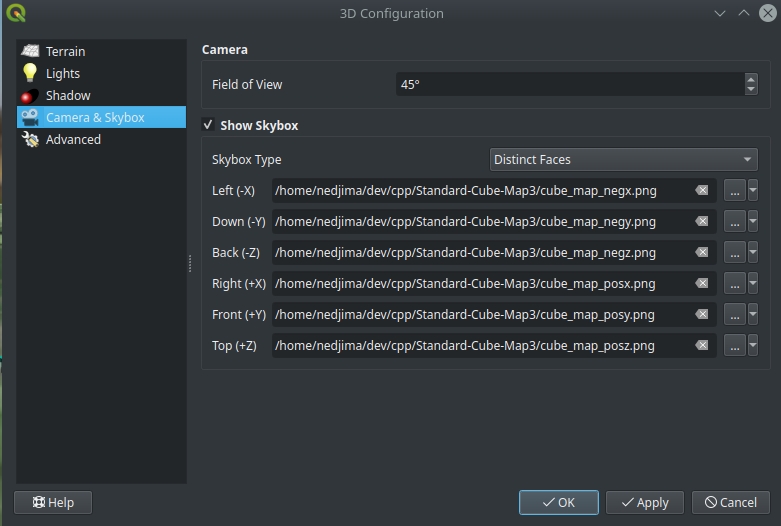 The result of applying a skybox to the scene:
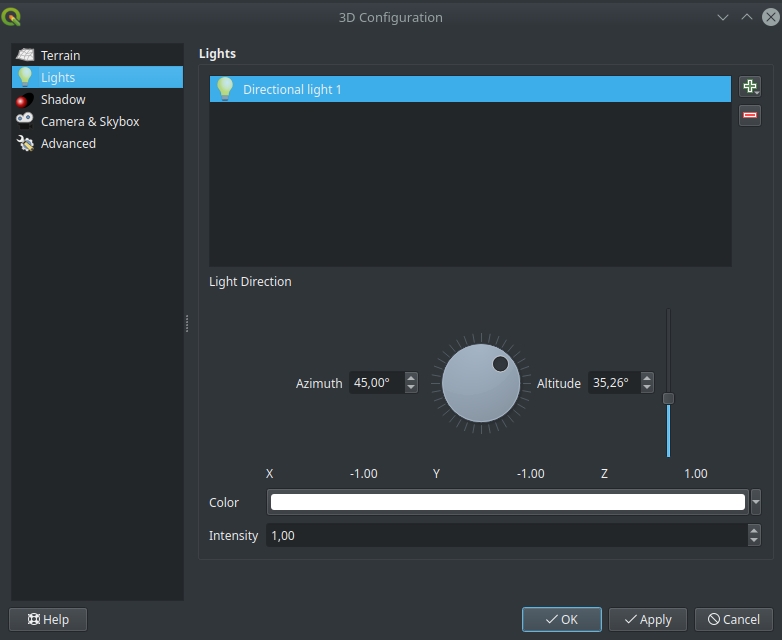
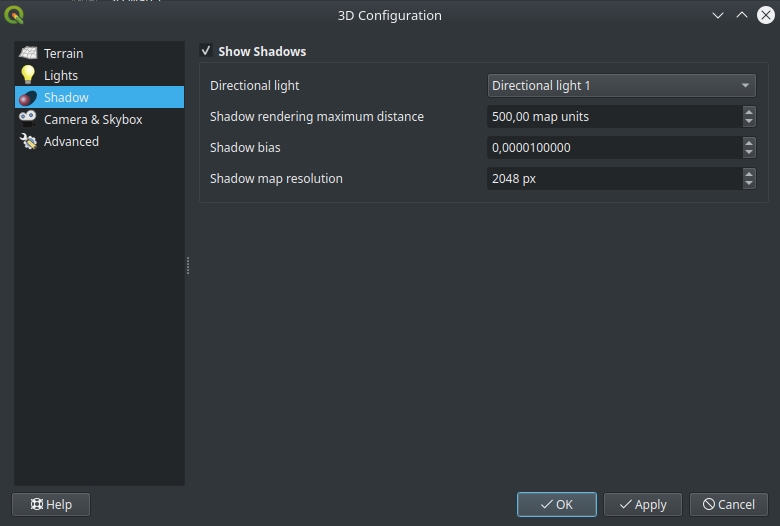 You can experiment with the shadow rendering parameters if you want to decrease the visual artifacts and make the shadows look better in the scene.
Here is how the shadows look like in our scene:
You can experiment with the shadow rendering parameters if you want to decrease the visual artifacts and make the shadows look better in the scene.
Here is how the shadows look like in our scene:


 icon to create a copy of the project under your own
Mergin account (foss4guk_YOURNAME)
icon to create a copy of the project under your own
Mergin account (foss4guk_YOURNAME) icon to download the project