
This plugin has an experimental version available!
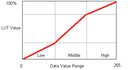
Summary of raster data can be view as histogram. The standard tool of QGIS allow to display a fine histogram for each band. Modification on image brightness or contrast is similar to a modification of histogram. More than contrast enhancement, PLCS bring the capability to do histogram equalization, hand-classification or color adjustment. It's also possible to use it in batch mode for a whole folder. Use the mouse-left button to drag breakpoints on histogram, and mouse-right button to add or delete breakpoints


