QGIS Planet

QField 3.2 “Congo”: Making your life easier

Focused on stability and usability improvements, most users will find something to celebrate in QField 3.2

Main highlights

This new release introduces project-defined tracking sessions, which are automatically activated when the project is loaded. Defined while setting up and tweaking a project on QGIS, these sessions permit the automated tracking of device positions without taking any action in QField beyond opening the project itself. This liberates field users from remembering to launch a session on app launch and lowers the knowledge required to collect such data. For more details, please read the relevant QField documentation section.

As good as the above-described functionality sounds, it really shines through in cloud projects when paired with two other new featurs.

First, cloud projects can now automatically push accumulated changes at regular intervals. The functionality can be manually toggled for any cloud project by going to the synchronization panel in QField and activating the relevant toggle (see middle screenshot above). It can also be turned on project load by enabling automatic push when setting up the project in QGIS via the project properties dialog. When activated through this project setting, the functionality will always be activated, and the need for field users to take any action will be removed.

Pushing changes regularly is great, but it could easily have gotten in the way of blocking popups. This is why QField 3.2 can now push changes and synchronize cloud projects in the background. We still kept a ‘successfully pushed changes’ toast message to let you know the magic has happened 🚀

With all of the above, cloud projects on QField can now deliver near real-time tracking of devices in the field, all configured on one desktop machine and deployed through QFieldCloud. Thanks to Groupements forestiers Québec for sponsoring these enhancements.

Other noteworthy feature additions in this release include:

  • A brand new undo/redo mechanism allows users to rollback feature addition, editing, and/or deletion at will. The redesigned QField main menu is accessible by long pressing on the top-left dashboard button.
  • Support for projects’ titles and copyright map decorations as overlays on top of the map canvas in QField allows projects to better convey attributions and additional context through informative titles.

Additional improvements

The QFieldCloud user experience continues to be improved. In this release, we have reworked the visual feedback provided when downloading and synchronizing projects through the addition of a progress bar as well as additional details, such as the overall size of the files being fetched. In addition, a visual indicator has been added to the dashboard and the cloud projects list to alert users to the presence of a newer project file on the cloud for projects locally available on the device.

With that said, if you haven’t signed onto QFieldCloud yet, try it! Psst, the community account is free 🤫

The creation of relationship children during feature digitizing is now smoother as we lifted the requirement to save a parent feature before creating children. Users can now proceed in the order that feels most natural to them.

Finally, Android users will be happy to hear that a significant rework of native camera, gallery, and file picker activities has led to increased stability and much better integration with Android itself. Activities such as the gallery are now properly overlayed on top of the QField map canvas instead of showing a black screen.

Snappy QField 3.1 “Borneo” has arrived

The launch of QField 3.0 was a big deal, but now we’re back to focusing on smaller, more frequent updates. Don’t let the shorter change log for 3.1 trick you – there are lots of cool new features in this update!

Main highlights

One of the main improvements in this release is the brand-new functionality to enable snapping to common angles while digitizing. When enabled, the coordinate cursor will snap to configured angles alongside a visual guideline. This comes in handy when adding new geometries while surveying features with regular angles (e.g. buildings, parking lots, etc.). As QField gets more digitizing functionalities, we’ve taken the time to implement a nifty UI that collapses digitizing toggle buttons into a drawer, leaving extra space for the map canvas to shine through.

In addition, the vertex editor – one of QField’s most advanced geometry tools – received tons of love during this development cycle, focusing on improving its usability. Changes worth mentioning include:

  • A new undo button allows users to revert individual vertex manipulations in case of mistaken adjustment, which can save you from having to cancel a large set of ongoing manipulations;
  • The possibility to select vertices using finger tapping on the screen, dramatically improving the user experience;
  • Clearer on-screen markers to represent vertices and
  • Tons of bug fixes to the vertex editor itself, as well as the broader set of geometry tools.

It is now possible to lock the geometry of individual features within a single vector layer. While QField has long supported the concept of a locked geometry state for vector layers, that was until now a layer-wide toggle. With the new version of QField, a data-defined property can dictate whether a given feature geometry can be edited. Interested in geofenced geometry editing? We’ve got you covered 😉 This functionality requires the latest version of QFieldSync, which is available through QGIS’ plugin manager.

Noticeably improvements

Permission handling has been improved across all platforms. On Android, QField now delays the permission request for camera, microphone, location, and Bluetooth access until needed. This makes for a much friendlier user experience.

QField 3.0 was one of the largest releases, with major changes in its underlying libraries, including a migration to Qt 6. With the community’s help, we have spent countless hours testing before release. However, it is never a bulletproof process, and that version came with a few noticeable regressions. In particular, camera handling on Android suffered from upstream issues with Qt. We’ve tracked as many of those as possible, making this new version much more stable. One lingering camera issue remains and will be fixed upstream in the next three weeks; we’ll update as soon as it is available.

Finally, long-time users of QField will notice improvements in how geometry highlights and digitizing rubber bands are drawn. We’ve doubled down on efforts to ensure that the digitized geometries and the coordinate cursor itself are always clearly visible, whether overlaid against the canvas’s light or dark parts.

We want to extend a heartfelt thank you to our sponsors for their generous support. If you’re inspired by the developments in QField and want to contribute, please consider donating. Your support will help us continue to innovate and improve this tool for everyone’s benefit.

Analyzing and visualizing large-scale fire events using QGIS processing with ST-DBSCAN

A while back, one of our ninjas added a new algorithm in QGIS’ processing toolbox named ST-DBSCAN Clustering, short for spatio temporal density-based spatial clustering of applications with noise. The algorithm regroups features falling within a user-defined maximum distance and time duration values.

This post will walk you through one practical use for the algorithm: large-scale fire event analysis and visualization through remote-sensed fire detection. More specifically, we will be looking into one of the larger fire events which occurred in Canada’s Quebec province in June 2023.

Fetching and preparing FIRMS data

NASA’s Fire Information for Resource Management System (FIRMS) offers a fantastic worldwide archive of all fire detected through three spaceborne sources: MODIS C6.1 with a resolution of roughly 1 kilometer as well as VIIRS S-NPP and VIIRS NOAA-20 with a resolution of 375 meters. Each detected fire is represented by a point that sits at the center of the source’s resolution grid.

Each source will cover the whole world several times per day. Since detection is impacted by atmospheric conditions, a given pass by one source might not be able to register an ongoing fire event. It’s therefore advisable to rely on more than one source.

To look into our fire event, we have chosen the two fire detection sources with higher resolution – VIIRS S-NPP and VIIRS NOAA-20 – covering the whole month of June 2023. The datasets were downloaded from FIRMS’ archive download page.

After downloading the two separate datasets, we combined them into one merged geopackage dataset using QGIS processing toolbox’s Merge Vector Layers algorithm. The merged dataset will be used to conduct the clustering analysis.

In addition, we will use QGIS’s field calculator to create a new Date & Time field named ACQ_DATE_TIME using the following expression:

to_datetime("ACQ_DATE" || "ACQ_TIME", 'yyyy-MM-ddhhmm')

This will allow us to calculate precise time differences between two dates.

Modeling and running the analysis

The large-scale fire event analysis requires running two distinct algorithms:

  • a spatiotemporal clustering of points to regroup fires into a series of events confined in space and time; and
  • an aggregation of the points within the identified clusters to provide additional information such as the beginning and end date of regrouped events.

This can be achieved through QGIS’ modeler to sequentially execute the ST-DBSCAN Clustering algorithm as well as the Aggregate algorithm against the output of the first algorithm.

The above-pictured model outputs two datasets. The first dataset contains single-part points of detected fires with attributes from the original VIIRS products as well as a pair of new attributes: the CLUSTER_ID provides a unique cluster identifier for each point, and the CLUSTER_SIZE represents the sum of points forming each unique cluster. The second dataset contains multi-part points clusters representing fire events with four attributes: CLUSTER_ID and CLUSTER_SIZE which were discussed above as well as DATE_START and DATE_END to identify the beginning and end time of a fire event.

In our specific example, we will run the model using the merged dataset we created above as the “fire points layer” and select ACQ_DATE_TIME as the “date field”. The outputs will be saved as separate layers within a geopackage file.

Note that the maximum distance (0.025 degrees) and duration (72 hours) settings to form clusters have been set in the model itself. This can be tweaked by editing the model.

Visualizing a specific fire event progression on a map

Once the model has provided its outputs, we are ready to start visualizing a fire event on a map. In this practical example, we will focus on detected fires around latitude 53.0960 and longitude -75.3395.

Using the multi-part points dataset, we can identify two clustered events (CLUSTER_ID 109 and 1285) within the month of June 2023. To help map canvas refresh responsiveness, we can filter both of our output layers to only show features with those two cluster identifiers using the following SQL syntax: CLUSTER_ID IN (109, 1285).

To show the progression of the fire event over time, we can use a data-defined property to graduate the marker fill of the single-part points dataset along a color ramp. To do so, open the layer’s styling panel, select the simple marker symbol layer, click on the data-defined property button next to the fill color and pick the Assistant menu item.

In the assistant panel, set the source expression to the following: day(age(to_date('2023-07-01'),”ACQ_DATE_TIME”)). This will give us the number of days between a given point and an arbitrary reference date (2023-07-01 here). Set the values range from 0 to 30 and pick a color ramp of your choice.

When applying this style, the resulting map will provide a visual representation of the spread of the fire event over time.

Having identified a fire event via clustering easily allows for identification of the “starting point” of a fire by searching for the earliest fire detected amongst the thousands of points. This crucial bit of analysis can help better understand the cause of the fire, and alongside the color grading of neighboring points, its directionality as it expanded over time.

Analyzing a fire event through histogram

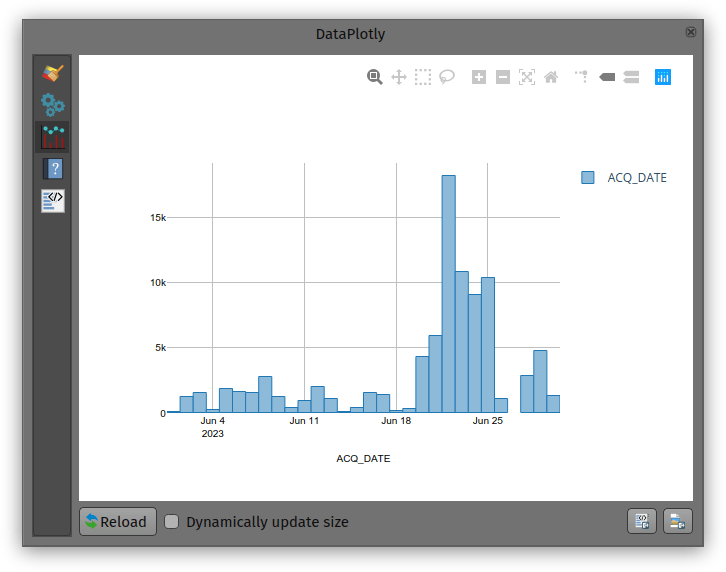
Through QGIS’ DataPlotly plugin, it is possible to create an histogram of fire events. After installing the plugin, we can open the DataPlotly panel and configure our histogram.

Set the plot type to histogram and pick the model’s single-part points dataset as the layer to gather data from. Make sure that the layer has been filtered to only show a single fire event. Then, set the X field to the following layer attribute: “ACQ_DATE”.

You can then hit the Create Plot button, go grab a coffee, and enjoy the resulting histogram which will appear after a minute or so.

While not perfect, an histogram can quickly provide a good sense of a fire event’s “peak” over a period of time.

QField 2.8: Boosting field work through external sensors

The latest version of QField is out, featuring as its main new feature sensor handling alongside the usual round of user experience and stability improvements. We simply can’t wait to see the sensor uses you will come up with!

The main highlight: sensors

QField 2.8 ships with out-of-the-box handling of external sensor streams over TCP, UDP, and serial port. The functionality allows for data captured through instruments – such as geiger counter, decibel sensor, CO detector, etc. – to be visualized and manipulated within QField itself.

Things get really interesting when sensor data is utilized as default values alongside positioning during the digitizing of features. You are always one tap away from adding a point locked onto your current position with spatially paired sensor readings saved as point attribute(s).

Not wowed yet? Try pairing sensor readings with QField’s tracking capability! 😉 Head over QField’s documentation on this as well as QGIS’ section on sensor management to know more.

The development of this feature involved the addition of a sensor framework in upstream QGIS which will be available by the end of this coming June as part of the 3.32 release. This is a great example of the synergy between QField and its big brother QGIS, whereas development of new functionality often benefits the broader QGIS community. Big thanks to Sevenson Environmental Services for sponsoring this exciting capability.

Notable improvements

A couple of refinements during this development cycle are worth mentioning. If you ever wished for QField to directly open a selected project or reloading the last session on app launch, you’ll be happy to know this is now possible.

For heavy users of value relations in their feature forms, QField is now a tiny bit more clever when displaying string searches against long lists, placing hits that begin with the matched string first as well as visually highlighting matches within the result list itself.

Finally, feature lists throughout QField are now sorted. By default, it will sort by the display field or expression defined for each vector layer, unless an advanced sorting has been defined in a given vector layer’s attribute table. It makes browsing through lists feel that much more natural.

Capturing more while in the field with the new QField 2.7

A brand new version of QField has been released, packed with features that will make you fall in love with this essential open source tool all over again with a focus on capturing more while you are in the field. QField 2.7 nicknamed “Heroic Hedgehog” also includes a number of worthy fixes making it a crucial update to get.

New recording capabilities

The highlight of QField 2.7 is the new audio and video recording capability straight from the feature form. In addition to preexisting still photo capture, this functionality allows for video motion and audio clips to be added as attachments to feature attributes.

The audio recording capability can come in handy in the field when typing on a keyboard-less device can be challenging. Simply record an audio note of observations to process later.

The experience wouldn’t be complete without audio and video playback support, which we took care of in this version too. Playback of such media content within the feature form gives an immediate feedback and saves time. For those interested in full screen immersion, simply click on the video frame to open the attached in your favorite media player. We also took the opportunity to implement audio and video playback on QGIS so people can easily consume the fruits of their labor in the field at their workstation.

We would be remiss if we didn’t mention map canvas rotation functionality added in this version. This is a long-requested functionality which we are happy to have packed into QField now. Pro-tip: when positioning is enabled, double tapping on the lower-left positioning button will have the map canvas follow both the device’s current location as well as the compass orientation.

Finally – some would argue “most importantly” 😉 – QField is now equipped with a beautiful dark theme which users can activate in the settings panel. By default on Android and iOS, QField will follow the system’s dark theme setting. In addition to the new color scheme, users can also adjust the user interface font size.

Big thanks to Deutsches Archäologisches Institut who funded the majority of the new features in this release cycle. Their investment in making QField the perfect tool for them has benefited the community as a whole.

A ton of bug fixing across all platforms

Important stability improvements and fixes to serious issues are also part of this release. Noteworthy fixes include WFS layer support on iOS, much better Bluetooth connectivity on Android, and vertical grid improvement on Windows.

For users facing reliability issues with the native camera on Android, we have spent time supersizing the camera we ship within QField itself. During this development cycle, it has gained zoom and flash controls, as well as a ton of usability improvements, including geo-tagging.

To know more about this release, read the full change log on QField’s github release page.

Powerful and gentle QField 1.8 Selma sneaked in

Get fieldwork smoothly and nimbly done despite the ice and snow outside. Collect accurate data with freehand digitizing and improved form widgets, use the data from your external GNSS receivers without any third-party apps and enjoy the pleasant usability of QField 1.8 Selma.

This year started off hi-speed for us. There’s been already a lot of coding, designing and teaching, and we’ve thrown ourselves into these things we love to do. And we published another QField release last week that I completely forgot to announce in this blog. But here it is. It’s QField 1.8, Selma. And it’s packed with cool features.

Let’s have a look.

Freehand drawing

This might be a feature that brings a lot of fun and professionalism to your work. The freehand digitizing mode allows the user to “draw” lines and polygons with the stylus pen. The mode is available for adding line/polygon features as well as for the ring tool of the geometry editor.

Together with the powerful options in the topological editing where you can snap to existing features and avoid overlaps, it’s very convenient to digitize complex shapes.

Zoom in and out

Speaking of fun. One day, a guy from the QGIS community asked us if we could implement the functionality to zoom in and zoom out like he is able to do with an app called Maps from a company named Google. I didn’t know what he meant, but he explained: Single finger double tap-and-hold zoom gesture (which allows you to zoom smoothly from anywhere on the screen). Wow! Didn’t know it before, but it’s super neat! So we made it available in QField as well.

If you are used to it, it’s quite easy. But for beginners it can be a bit difficult. So for people who are not that deft – and to keep the UX self-explanatory and simple – we also added two buttons + / – to zoom in and zoom out with just one finger. So now even a clumsy pirate with a hook instead of a hand can collect data with QField 🙂

Powerful Relation Reference Widget

Let’s be a little bit more serious and talk about how powerful the relation reference widget has become.

View and Edit selected feature

The intuitive eye icon next to the widget lets you open the form of the referenced parent feature to view and edit it.

Autocomplete mode

When auto-complete is enabled, you can easily perform a search in all available parent features.

autocomplete

With space-separated input, you can search for the beginning of multiple words in the display name of the parent features. So in this example searching for “Ma” will find the name “Mae” and “Marie” and using the second word “buck” it finds the Buckfast bees – so the entries containing both values will be listed on top.

Integration of external GNSS receivers

In case you wondered, why we did not release 1.8 Selma earlier? Because we wanted to have it feature loaded and rocket proof. And one of this cool feature is the integration of external GNSS receivers.

QField can receive and decode NMEA sentences received via Bluetooth from an external GNSS receiver (such as an EMLID Reach RS2) without the need for any third party app.

nmea

Search for paired Bluetooth devices in the device settings, connect to the external device and receive the GNSS information.

Select vertical grid shift files

In the QField settings, you can select a grid file on your mobile device by placing it in a directory named QField/proj in the main folder of the internal storage to increase the vertical location accuracy.

Postgres Config File

If you once started using PostgreSQL configuration files, you don’t want to live without them anymore. And when you use it on your PC, I’m sure you want to use it on your mobile device as well.

Define Postgresql services in a pg_service.conf file and use it on QField by placing it directly in a directory named QField in the main folder of the internal storage.

Add reload data button

The layer properties have been polished and in addition, you will find a button to reload the layer data. This is especially useful if you use WFS layers from which you need to get updates.

nmea

Register extra fonts

Also, you can add TTF and OTF font files into a directory named QField/fonts at the main folder of the internal storage to use the nice fonts you like.

fonts

How beautiful is that!

Support of new raster file formats

By the way: Many new raster file formats are supported – most notably COG. While not yet supported as remote format streamed directly from the web, it is also a high performance format if used locally

What about the cloud?

You might be one of these people eagerly waiting and always receiving the same message: Keep calm, it’s coming soon. Sorry for that. But when we do something, we do it right. And we prefer to have a stable solution than to publish half baked stuff. We are still highly busy coding, testing and promoting QFieldCloud. It’s announced for this spring / early summer.

Also, keep an eye on the @QFieldForQgis and @QFieldCloud twitter accounts to stay updated.

We ♥ our Beta Testers

The Beta Testers are our secret heroes. They report bugs and inconveniences before the normal users are bothered with them. Thanks to the Beta Testers QField is so stable. And at this point we would like to say: Thank you, test heroes!

And what do the beta testers get in return? Well, they can be the very first to try out the great new features. This is exciting and fun. So don’t hesitate. Join the beta.

In the Play Store you should find this section under the “QField for QGIS” app listing. Enjoy the feature frenzy and report the problems at qfield.org/issues

And if you wondered…

… why this release is called “Selma”. It’s of course because of the Mount Selma in Australia… And because it’s the name of my beloved cat. That’s her – Selma Eulenkopf – staring at me while I’m coding QField.

QField 1.7 Rockies hits the stage

Be ready for the cold weather with a smooth coordinate search, filters in the value relation widget, fancy new QML and HTML widgets, enhanced geometry editing functionalities and an expandable legend. Right when Autumn starts, QField 1.7 Rockies hits the stage.

As usual get it now on the play store or on github!

The days are getting shorter and the wind blows colder. It’s always good to be in a good company outside while getting your mapping work done. QField will be your reliable companion.

We know, QField 1.6 Qinling has only been out two months and with its amount of new features and stability improvements, it would have deserved a longer primetime. But we just couldn’t withhold you all the new great stuff we’ve been building lately.

So let’s welcome QField 1.7 Rockies. And yes, we mean THE Rockies, where QField is looking for plenty of new buddies.

Let’s have a look.

Merging features

Splitting of a feature has been possible for quite some time. Now the merging of features of multipolygon-layer is possible as well. Select them and merge them – easy like that. The first selected feature gets the new geometry and keeps its attributes.

Filters in the Value Relation Widget

The value relation widgets provide an easy selection of a related feature. Often it’s used for lookup tables but sometimes the related tables contain a lot of entries and the list of the possible values is long.

Using filters in the value relation drop-down can increase the efficiency in selecting the correct value. It can be configured by expressions in QGIS, so it’s possible to have the content of the drop down depend on the values entered previously in other fields.

In the screenshot above there is a Map Value Widget with “forest” and “meadow” as values. On selecting “forest”, only the trees appear in the Field “Plant Species”. On selecting “meadow” there would be listed flowers instead.

Go to coordinates in the Search

The search has not only been improved in its appearance, but it’s handling is much more comfortable with a button to clear the text and easy opening and closing.

Additionally, we added the possibility to jump to coordinates. Searching a place you know the coordinates of is now super simple. And this means that digitizing that precise geometry with known coordinates is finally possible.

coordinates

QML and HTML Widget

You might remember when we introduced the QML widget in QGIS. Now it’s in QField as well. And it’s not alone. HTML widgets are supported too.

This provides a lot of possibilities to display information with texts, images and charts and it even allows you interaction.
Do you need help setting up complex forms? Don’t hesitate to get in touch with us!


Expandable legend icons

The legend items are now expandable and collapsible.

Wait a minute… Wasn’t this possible before? Yes. It was possible in earlier versions. But why it’s announced here as a new feature?

Because now it is built in a future proof manner thanks to all the people and organisations who care for QField and bought a support contract with the sustainability initiative or committed to a recurring sponsorship.

Some technical background: As you may be aware QField uses QGIS under the hood and QGIS uses Qt under the hood. Qt is currently used in version 5. Qt 5 is not that young any more and has a lot of functionality which is no longer supported by Qt. The old legend was based on the tree view, a deprecated module. Using it had some implications like the suboptimal support of HiDPI. Furthermore, these deprecated modules will disappear in the soon-to-come Qt 6.

As you can see, keeping QField at the quality we and you expect requires a lot of maintenance work. It is of utmost importance and only possible thanks to sponsoring since paying for fixing already existing features is less attractive for most people.

What will the future bring

In the last weeks, we have been highly busy on coding, testing and promoting QFieldCloud and we are very happy to be able to announce it very soon. So be prepared.

Also, keep an eye on the @QFieldForQgis and @QFieldCloud twitter accounts to stay updated.

Open Source

QField is an open source project. This means that whatever is produced is available free of charge. To anyone. Forever. This also means that everyone has the chance to contribute. You can write code, but you don’t need to. You can also help translating the app to your language or help out writing documentation or case studies or by sponsoring a new feature.

And now…

… enjoy QField 1.7 Rockies and have a nice autumn!

QField 1.6 is out!

Editing multiple features at the same time, support for stylus pens, dynamic configuration of image names and much more.
QField 1.6 Qinling 秦岭 comes packed with awesome new features and an improved user experience.

We have been very busy over the last few months working on a new and shiny QField release. We have added many new features that increase efficiency on the field or allow for new workflows. In parallel, we have also been working on ironing out a series of issues and improving the overall user experience to make the app as pleasurable to use as possible. The result is QField 1.6 which has been published now.

Enough of the highlevel talking, let’s see what has been done.

Multi editing

Do you recall Geography lesson 101, Toblers first law? Everything is related to everything else. But near things are more related than distant things.

Very often there are similar objects nearby which share a property, tree species tend to group, human created objects like street light types or street paint markings tend to be of the same type at the same location.

With QField 1.6 it is now much easier to select a couple of features and change an attribute with very few taps. Identify a feature, long press an identify results, select more features and click the edit attributes button.

Stylus support

Sometimes it is just too cold to be working with fingers (although of course you can get capacitive gloves too). Or you just prefer to be working with a pen. QField 1.6 comes with support for stylus pens. If your device ships with one, give it a try.

Lock geometries

For some scenarios, especially in asset management, you only need to change attributes of existing objects and never add new features, delete features or change geometries. This can be configured through QFieldSync and set in the layer properties.

Image name configuration

Did you ever want to have the file names of your pictures to match the feature id, the layer name or any free text? The expression based configuration in QFieldSync offers now complete freedom in naming your images.

Legend and UX and legacy code

Didn’t expect to read UX and legacy code in one single title?

QML is the technology on which the QField user interface is built. QML ships a lot of user interface elements in a library called “Quick Controls”. A long time ago already it received an update from version 1 to version 2. Up to recently we still have been using some elements from version 1, which had an effect on high resolution displays not being able to properly display everything. To workaround that we introduced a lot of band aids, to improve the situation. We are very happy, that by migrating the legend and few other remaining elements to Quick Controls 2 in version 1.6, we have been able to completely drop this code.

Topological editing

QGIS can detect shared boundary by the features, so you only have to move a common vertex once, and QGIS will take care of updating the neighboring ones. So does his little college QField since this release.

Fast editing mode

For the real adventurers who know what they are doing this release brings the fast editing mode. In this mode, the features will automatically be stored on every change. The user interface is lighter and it combines perfectly with the topological editing.

Unter the hood

We have brought the whole technology stack up to speed with modern requirements. Proj and GDAL have been updated to recent versions. This helped to mitigate a couple of issues with coordinate transformations that were completely misplaced. It also paves the path for a future with datum corrections and always more important high precision measurements.

Known Issues

Unfortunately, we are experiencing a crash on startup with 32 bit devices. These devices are not that common any more, but if you have a device that is already a couple of years old it’s very well possible that it comes with a 32 bit cpu builtin. Despite the team’s hard efforts to isolate the reason, we were not able to find out what it was yet. Because of this we will not be able to update to 1.6 for these devices at the moment. We still hope that we will find a solution for this but don’t know yet when this will be.

We have updated proj to version 6. This brings plenty of bug fixes with coordinate handling. Among other things it adds support for using datum grids (gsb files) for very precise transformations, it is not yet possible to install those on the device. You will get an information message in the about dialog if your project happens to fall into this category. In this case, as a workaround switch the CRS of the project to a CRS with a known conversion that works without grid files.

What will the future bring

You guessed it already, we are not tired and have plenty of things stacked for the future. Prepare for more exciting updates for attribute forms and also for QFieldCloud which is right now being tested in our R&D labs.

Also keep an eye on the @QFieldForQgis Twitter account to stay updated.

Open Source

QField is an open source project. This means that whatever is produced is available free of charge. To anyone. Forever. This also means that everyone has the chance to contribute. You can write code, but you don’t need to. You can also help translating the app to your language or help out writing documentation or case studies or by sponsoring a new feature.

Thanks to sponsors

Various organisations have helped to make this new release become a reality. Without the support of people in organisations who believe in the future of QField and open source tool for geospatial in general. The whole team behind QField would like to thank you with a big applause!

Back to Top

Sustaining Members